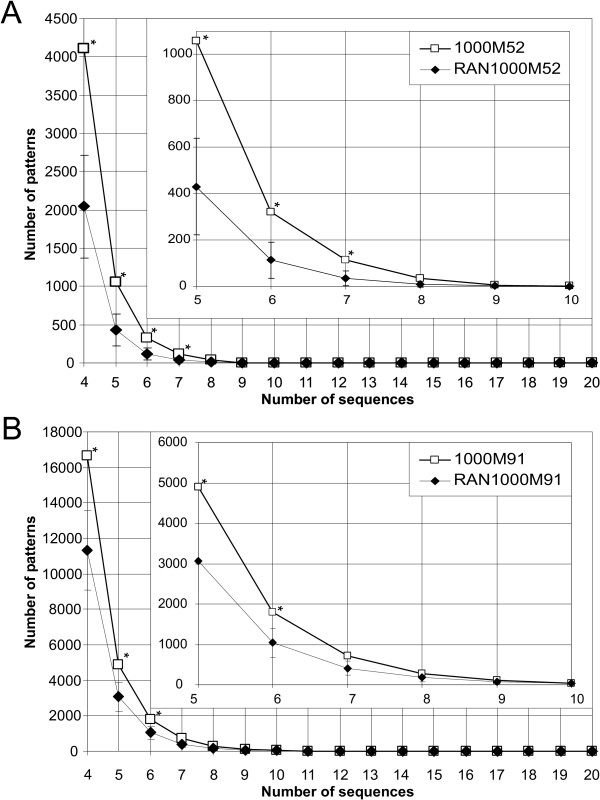
Figure 2.
Comparison of patterns discovery results in retinal gene promoter sequences and in 1,000 negative control datasets. Plots of number of patterns (12 bp long, with at most two variable positions) vs number of sequences in which they were found, in retinal gene promoter sequences (open squares) and in 1,000 negative control datasets (filled diamonds). For negative control datasets, the average value of 1,000 sets of sequences is given, with a two standard deviations interval. Statistically significant differences (0.05 threshold) are marked by stars. (A) Comparison between the 1000M52 dataset (52 promoter sequences of genes overexpressed in the retina) and the RAN1000M52i dataset (1,000 groups of 52 randomly chosen human promoters); (B) Comparison between the 1000M91 dataset (91 retinal gene promoter sequences) and the RAN1000M91i (1,000 groups of 91 randomly chosen human promoters).

