
Figure 1.
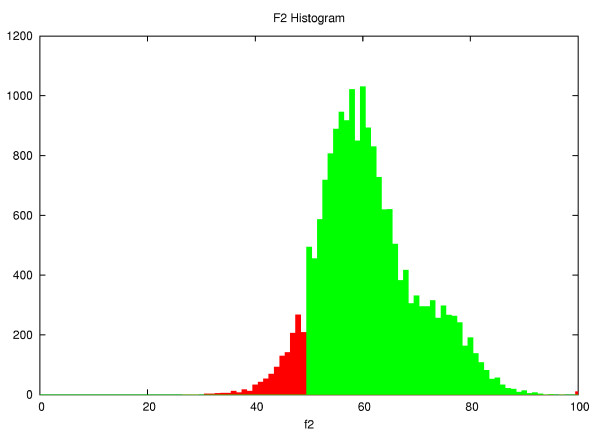
f2 histogram. Histogram of the f2 values from the 17,502 alignments used to construct the matrix.
Official websites use .gov
A
.gov website belongs to an official
government organization in the United States.
Secure .gov websites use HTTPS
A lock (
) or https:// means you've safely
connected to the .gov website. Share sensitive
information only on official, secure websites.
f2 histogram. Histogram of the f2 values from the 17,502 alignments used to construct the matrix.