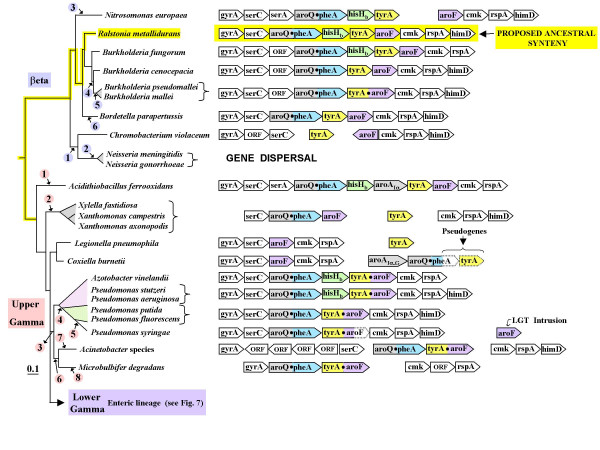
Figure 6.

Zoom-in from Fig. 5 showing tyrA synteny for the beta Proteobacteria and the upper-gamma Proteobacteria. The tree shown, based upon 16S rRNA sequences of the indicated organisms, indicates correct branching orders, but (to facilitate presentation) is not strictly correct in proportion. Circled numbers (in violet) indicate deduced evolutionary events for the beta Proteobacteria (see top of Table 5), whereas circled numbers (in pink; see bottom of Table 5) correspond to deduced evolutionary events for the upper-gamma Proteobacteria. Gene organizations of organisms indicated are shown on the right. The dotted outlining of some gene boxes in Coxiella burnetii and in P. syringae indicates pseudogene status.
