
Figure 5.
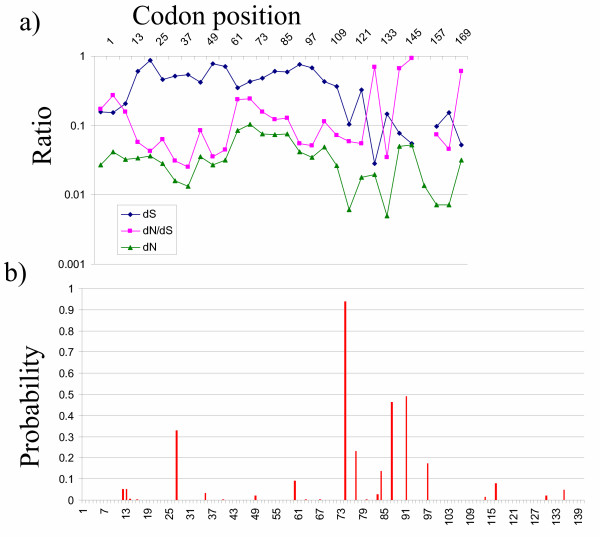
Synonymous/nonsynonymous mutation rates and selection in HBVc. Panel a shows the distribution of synonymous (dS) and non-synonymous (dN) substitutions (the number of such substations per site), and the ratio dN/dS along the sequence of HBVc. Gaps indicate dS = 0. Panel b shows the posterior probability p+ that dN/dS>1 for each position of HBVc, as calculated by PAML. The probability that dN/dS<1 (purifying selection) is not plotted for clarity but is given by (1- p+).