
Figure 4.
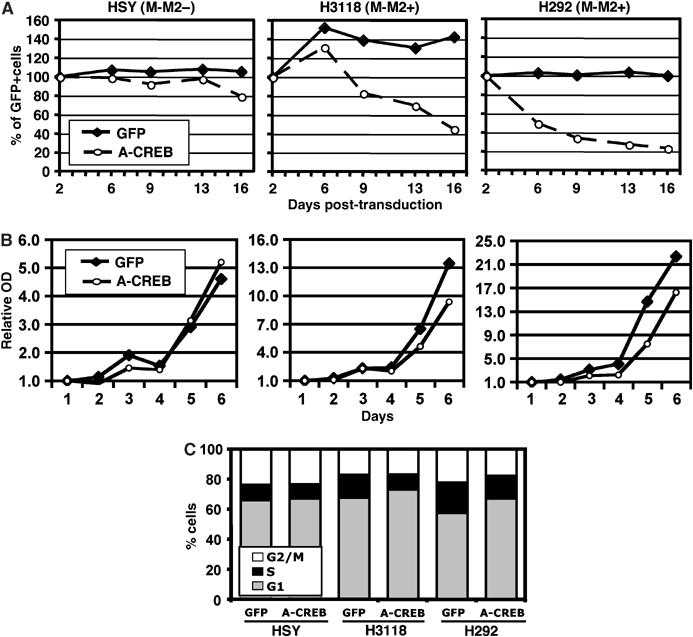
Disruption of CREB activity significantly suppressed the growth of two human MECT1-MAML2-positive MEC cell lines. (A) A representative diagram showing the changes in the percentage of GFP-positive cells between cell populations expressing A-CREB and GFP and their control counterparts expressing GFP only. Two MECT1-MAML2-expressing MEC cell lines, H292 and H3118, along with the immortalized normal parotid cell line HSY (MECT1-MAML2 negative), were transduced with A-CREB or control GFP viruses. The percentages of GFP-positive cells were determined by FACS analysis at 3–4 days intervals, for a total of 15 days. The percentage of GFP-positive cells at day 2 postinfection was considered as 100%, and the remaining data were normalized. (B) A representative growth curve of cells expressing A-CREB plus GFP versus controls expressing GFP only. The cell number was determined using crystal blue staining daily for 6 days. (C) Cell cycle distribution of HSY, H3118, and H292 cells transduced with A-CREB viruses or vector control viruses as determined by propidium iodide straining followed by FACS analysis.