

Abstract
Aims
To enhance ovarian tumor diagnosis beyond conventional methods, this study explored combining diffusion‐weighted magnetic resonance imaging (DWI‐MRI) and serum biomarkers (Mucin 1 [MUC1], MUC13, and MUC16) for distinguishing borderline from malignant epithelial ovarian tumors.
Methods
A total of 126 patients, including 71 diagnosed with borderline (BEOTs) and 55 with malignant epithelial ovarian tumors (MEOTs), underwent preoperative DWI‐MRI. Region of interest (ROI) was manually drawn along the solid component's boundary of the largest tumor, focusing on areas with potentially the lowest apparent diffusion coefficient (ADC). For entirely cystic tumors, a free‐form ROI enclosed the maximum number of septa while targeting the lowest ADC. Serum biomarkers were determined using enzyme‐linked immunosorbent assay.
Results
Basic morphological traits proved inadequate for malignancy diagnosis, warranting this investigation. BEOTs had an ADC mean of (1.670 ± 0.250) × 103 mm2/s, while MEOTs had a lower ADC mean of (1.332 ± 0.481) × 103 mm2/s, with a sensitivity of 63.6% and specificity of 90.1%. Median MUC1 (167.0 U/mL vs. 87.3 U/mL), MUC13 (12.44 ng/mL vs. 7.77 ng/mL), and MUC16 (180.6 U/mL vs. 36.1 U/mL) levels were higher in MEOTs patients. The biomarker performance was: MUC1, sensitivity 50.9%, specificity 100%; MUC13, sensitivity 56.4%, specificity 78.9%; MUC16, sensitivity 83.64%, specificity 100%. Combining serum biomarkers and ADC mean resulted in a sensitivity of 96.4% and specificity of 100%.
Conclusion
The integration of DWI‐MRI with serum biomarkers (MUC1, MUC13, and MUC16) achieves exceptional diagnostic accuracy, offering a powerful tool for the precise differentiation between borderline and malignant epithelial ovarian tumors.
Keywords: biomarkers, diffusion‐weighted magnetic resonance imaging, epithelial ovarian cancer, sensitivity and specificity
The combination of blood serum markers MUC1, MUC13, and MUC16 with DWI‐MRI shows promise as a diagnostic tool for distinguishing borderline from malignant ovarian tumors
1. INTRODUCTION
Epithelial ovarian cancer (EOC) is the most lethal gynecological malignancy, which is also the second most common gynecological neoplasm behind endometrial cancer, being the eighth leading cause of cancer death in women worldwide. 1 According to data from Global Cancer Statistics 2020 (all ages), an estimated total of 313, 959 new cases were diagnosed worldwide with an estimated death of 207, 252 worldwide. 2 , 3 Borderline epithelial ovarian tumors (BEOTs) are a type of neoplasm with low malignant potential that can affect women of all age groups; however, on average, women diagnosed with BEOTs tend to be around 40 years old, which is notably younger than the average age of women diagnosed with malignant epithelial ovarian tumors (MEOTs), who are typically 15 years older. 4
Magnetic resonance imaging (MRI) can bring new possibilities in the differentiation of ovarian neoplasms. 5 , 6 Diffusion‐weighted imaging MRI (DWI‐MRI) provides coverage of the abdomen and pelvis with high contrast between tumor and non‐tumor tissue, which is increasingly being explored in EOC. 7 Moreover, studies have shown that DWI is valuable for differentiating BEOTs from MEOTs. 8 , 9 The apparent diffusion coefficient (ADC) represents the slope of the curve between the natural logarithm of the measured signal intensity for different b values (a combination of gradient pulse amplitude, the time for which the gradients are applied, and the time that elapses between their application). 10 The combination of DWI‐MRI and serum markers can offer more comprehensive and precise guidance for subsequent clinical cancer treatments, 11 , 12 including EOC patients. 13 , 14
Mucins are widely recognized as epithelial cell markers that have been extensively investigated for their potential utility in the diagnosis, prognosis, and treatment of epithelial cancers. 15 To date, a number of human mucins, including Mucin 1 [MUC1], MUC3A, MUC3B, MUC4, MUC12, MUC13, MUC15, MUC16, MUC17, MUC20, and MUC21, have been identified. 16 MUC1, also known as Episialin, MAM‐6, CA 15‐3, PEM, and EMA, is a well‐characterized member of the mucin family. It is a membrane‐bound glycoprotein that is expressed on the apical surface of epithelial cells. MUC1 has been extensively studied in various cancers, including ovarian cancer, where it is considered a tumor‐associated antigen and an oncoprotein. 15 , 17 In 1982, MUC16 (also referred to as CA125) was identified as a serum biomarker for ovarian cancer. However, relying solely on MUC16 for screening may result in delayed diagnosis with low specificity and poor outcomes for women. 18 , 19 Ren et al. identified a novel potential role of MUC13 as a serum biomarker for ovarian cancer, suggesting MUC13 may complement the commonly used biomarker MUC16 in detecting certain subtypes of non‐serous ovarian carcinoma and early‐stage disease. 20
This study represents a pioneering effort to investigate the diagnostic prowess of DWI combined with serum levels of MUC1, MUC13, and MUC16 in distinguishing between borderline and malignant epithelial ovarian tumors. By evaluating the potential of these biomarkers, our aim is to enhance the accuracy of EOC diagnosis, provide a non‐invasive and efficient diagnostic approach, and ultimately advance the clinical management of this formidable disease. This innovative approach holds significant promise in revolutionizing the landscape of EOC diagnosis and treatment, addressing a critical need in women's healthcare.
2. MATERIALS AND METHODS
2.1. Ethical statement
Prior to using their biological material for scientific purposes, all patients provided informed consent in accordance with the regulations set forth by the ethics committee of PingYang People's Hospital.
2.2. Patient population
In this prospective study, a total of 178 patients with known or suspected epithelial ovarian tumors treated at our hospital between May 2018 and May 2022 were included. Eligible patients, aged 18 or older, provided preoperative blood samples and gave informed consent before undergoing standard pelvic MRI with T1‐weighted imaging (TIWI), T2WI, and DWI. Pathological confirmation of borderline epithelial ovarian tumors (BEOTs) or MEOTs following surgical resection was required. Excluding 52 patients who did not meet the criteria, reasons for exclusion included incomplete data (n = 15), other concurrent malignant tumors (n = 2); prior anti‐tumor treatments, such as radiotherapy and/or chemotherapy (n = 28); pre‐existing medical complications such as blood diseases, thrombotic diseases, severe liver and kidney damage, infectious diseases, autoimmune diseases, and pregnancy (n = 5), and poor image quality due to motion artifacts caused by respiratory (n = 1) or bowel peristalsis (n = 1). Finally, 126 patients were enrolled, comprising 55 with MEOTs and 71 with BEOTs. MEOTs patients underwent comprehensive staging surgery involving hysterectomy, adnexectomy, pelvic/para‐aortic lymphadenectomy, omentectomy, and peritoneal cytology. A flowchart illustrating patient selection and inclusion/exclusion criteria is shown in Figure 1.
FIGURE 1.
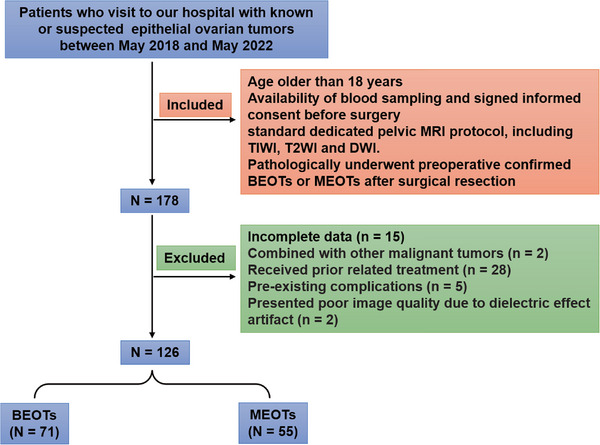
Flowchart illustrating patient selection and inclusion/exclusion criteria.
2.3. DWI‐magnetic resonance imaging
MRI scans were done on a 1.5 T scanner (Signa HDxt GE) using a complete protocol (T2 and T1 weighted imaging in three planes, with DWI/ADC), avoiding hemorrhage, visible vessels, necrotic regions, and large cystic areas. Axial DWI was performed using the EPI technique with the following scan parameters: a TR of 3900 ms, a TE of 85 ms, a slice thickness of 6 mm, a slice spacing of 2 mm, a matrix of 128 × 128, and a FOV of 280 mm2. DWI sequences acquired images at two specific b‐values were used: 0 and 800 s/mm2. Subsequently, the ADC was calculated by fitting the signal with these two b‐values. The scan range was planned to cover the entire tumor by using pre‐planned scout images. Tumors were categorized based on their composition: purely cystic, mainly cystic (less than one‐third solid component), mixed cystic‐solid (one‐third to two‐thirds solid component), and mainly solid (more than two‐thirds solid component). 21 The solid component encompassed a solid portion (entirely enhancing solid masse) and papillary projections (solid projections into the cyst from the cyst wall with a height ≥ 3 mm). 22 Radiologists manually delineated the region of interest (ROI) along the solid component's boundary on slices with the largest tumor, focusing on areas exhibiting potentially the lowest ADC values. In cases where a tumor was entirely cystic, a free‐form ROI was drawn to encompass the maximum number of septa within the entire lesion while targeting the lowest ADC value. A minimum of three measurements were taken and subsequently averaged for accuracy.
ADC measurements were conducted using the GE Advanced Workstation 4.6 by two proficient radiologists with extensive gynecological imaging experience spanning over 5 years. These radiologists were kept uninformed about the histological diagnoses, and both possessed specialized training and expertise in this specific research domain. They collaboratively reviewed all images together. Consensus between the two radiologists was achieved through comprehensive individual evaluations during a conference discussion. Representative images have been provided in Figures S1 and S2.
2.4. Assay of serum markers
Blood samples were obtained from EOC patients using standard venipuncture procedures and were not subjected to any preservation or stabilization measures prior to subsequent processing and analysis. The samples were then stored at −80°C until the time of analysis, which was conducted within two days prior to surgery. The serum expression levels of MUC1, MUC13, and MUC16 were determined using enzyme‐linked immunosorbent assay (ELISA) kits obtained from Bio‐Techne China Co. Ltd. The human ELISA kits used for the detection of MUC1, MUC16, and MUC13 were Catalog#: NBP2‐59962, Catalog#: NBP2‐59961, and Catalog#: NBP2‐76698, respectively. MUC1 showed inter‐assay coefficient of variation (CV) < 20%, and intra‐assay CV < 15%, with detection from 15 U/mL to 250 U/mL and sensitivity of 3.8 U/mL. MUC13 had inter‐assay CV < 5.39%, and intra‐assay CV < 4.99%, detecting from 0.156 to 10 ng/mL, with a sensitivity of 0.094 ng/mL. MUC16 demonstrated inter‐assay CV < 20%, intra‐assay CV < 15%, detecting from 16 to 300 U/mL, and sensitivity of 3.8 U/mL.
2.5. Statistical analysis
Continuous variables were assessed for normality using a one‐sample Kolmogorov‐Smirnov test, and their data were expressed as either the mean with standard deviation (SD) or the median with an interquartile range (IQR). The parametric t‐tests for independent groups were used to test the significance of differences between mean values due to normal distribution, while the Mann‐Whitney U test was used for non‐parametric data. Receiver operator characteristic (ROC) curves were constructed to evaluate the diagnostic performance for distinguishing borderline from malignant epithelial ovarian tumors. Cut‐off points were employed for the computation of sensitivity and specificity using the Youden index. 23 The DeLong analysis, conducted using MedCalc software (MedCalc Software Ltd), encompassed pairwise comparisons of ROC curves for various biomarkers, including MUC1, MUC13, MUC16, and ADC measurements. The predictive capacity subsequent to binary logistic regression was assessed through ROC analysis. Statistical significance, denoting a two‐sided p‐value less than 0.05, was determined using GraphPad Prism 8.0 software (GraphPad Software).
3. RESULTS
3.1. Population characteristics
As demonstrated in Table 1, the mean ages of the patients diagnosed with BEOTs and MEOTs were (41.77 ± 11.88) and (47.33 ± 20.16) years, respectively (p = 0.056). Tumor configuration varied significantly between the two groups (p < 0.001). BEOTs predominantly exhibited purely cystic (46.48%) or mainly cystic (43.66%) configurations, while MEOTs had a higher proportion of mixed cystic‐solid (21.82%) and mainly solid (10.91%) configurations. Regarding the number of loculi, both groups had a substantial presence of multilocular tumors with no significant difference (p = 0.532). Notably, MEOTs were more likely to feature a solid component within the tumors compared to BEOTs (p < 0.001), with 90.91% of MEOTs having this characteristic. Ascites severity, categorized as no, mild, or moderate, showed no significant difference (p = 0.624) between the two groups, with the majority presenting with mild or no ascites.
TABLE 1.
The characteristics of patients diagnosed with borderline epithelial ovarian tumors (BEOTs) and malignant epithelial ovarian tumors (MEOTs).
| Characteristic | BEOTs (n = 71) | MEOTs (n = 55) | p‐value |
|---|---|---|---|
| Age (years) | 41.77 ± 11.88 | 47.33 ± 20.16 | 0.056 |
| Configuration | |||
| Purely cystic | 33 (46.48%) | 4 (7.27%) | |
| Mainly cystic | 31 (43.66%) | 33 (60.00%) | |
| Mixed cystic‐solid | 5 (7.04%) | 12 (21.82%) | |
| Mainly solid | 2 (2.82%) | 6 (10.91%) | <0.001 |
| Number of loculi | |||
| Unilocular | 10 (14.08%) | 10 (18.18%) | |
| Multilocular | 61 (85.92%) | 45 (81.82%) | 0.532 |
| Solid component | 35 (47.89%) | 50 (90.91%) | <0.001 |
| Ascites | |||
| No | 15 (21.13%) | 9 (12.68%) | |
| Mild | 50 (70.42%) | 38 (53.52%) | |
| Moderate | 7 (9.86%) | 8 (11.27%) | 0.624 |
3.2. Comparison of ADC mean value and serum MUC1, MUC13, and MUC16 levels between BEOTs and MEOTs
As depicted in Figure 2A, the ADCmean value for BEOTs was (1.670 ± 0.250) ×103 mm2/s, while the average ADC value of MEOTs was (1.332 ± 0.481) ×103 mm2/s, indicating a lower ADC value in the MEOT group (p < 0.001). The levels of MUC1 were significantly higher in patients with malignant disease (median concentration: 167.0 U/mL; IQR: 81.5–239.2 U/mL) than in those with benign disease (median concentration: 87.3 U/mL; IQR: 44.9–114.6 U/mL), with a statistically significant difference (p < 0.001, Figure 2B). Patients with MEOTs had a significantly greater concentration of MUC13 (median concentration: 12.44 ng/mL; IQR: 5.3–16.01 ng/mL) compared to those with BEOTs (median concentration: 7.77 ng/mL; IQR: 4.35–10.70 ng/mL), and this difference was statistically significant (p < 0.001, Figure 2C). Furthermore, women diagnosed with MEOTs had markedly higher levels of serum MUC16 (median value: 180.6 U/mL; IQR: 98.3–266.7 U/mL) compared to BEOTs (median value: 36.1 U/mL; IQR: 18.1–52.0 U/mL), with a highly statistically significant difference (p < 0.001, Figure 2D).
FIGURE 2.
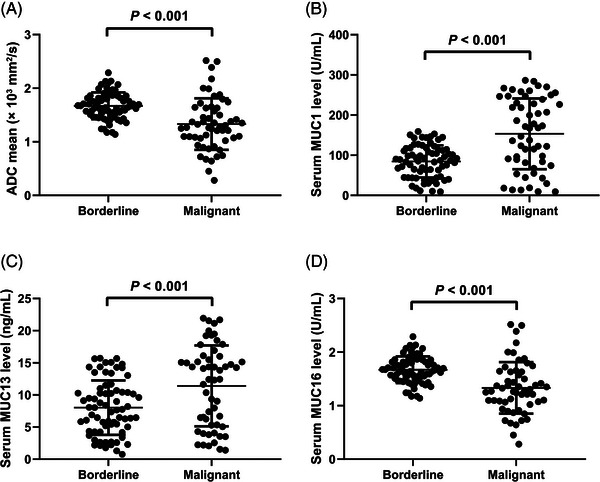
Analysis of the average apparent diffusion coefficient (ADC) value (A) and the serum levels of Mucin 1 (MUC1) (B), Mucin 13 (MUC13) (C), and Mucin 16 (MUC16) (D) in patients with malignant epithelial ovarian tumors (MEOTs) and those with borderline epithelial ovarian tumors (BEOTs).
3.3. Diagnostic performance of ADC mean value and serum levels of MUC1, MUC13, and MUC16 in discriminating between BEOTs and MEOTs
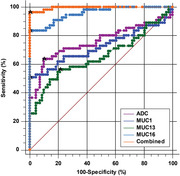
ROC curve analysis was employed to assess the diagnostic efficacy of ADC mean value and serum levels of MUC1, MUC13, and MUC16 in distinguishing between BEOTs and MEOTs (Figure 3 and Table 2). For ADCmean, the analysis yielded an area under the curve (AUC) of 0.757 with a 95%CI of 0.673–0.829 and a p‐value less than 0.001. The calculated cut‐off value was 1.381 × 103 mm2/s, with a sensitivity of 63.6% (95%CI: 49.6–76.2) and a specificity of 90.1% (95%CI: 80.7–95.9). The Youden index J was 0.538. For MUC1, a cut‐off value of 159.2 U/mL was identified with an AUC of 0.723 (95%CI: 0.636–0.799, p < 0.001) to differentiate between BEOTs and MEOTs, and the sensitivity and specificity were 50.9% (95%CI: 37.1–64.6) and 100% (95%CI: 94.9–100.0), respectively, with a Youden index J of 0.509. The AUC for the diagnostic performance of serum MUC13 in discriminating between BEOTs and MEOTs was 0.656 (95%CI: 0.566 to 0.738, p = 0.003) with a cut‐off value of 11.52 ng/mL. The sensitivity and specificity were 56.4% (95%CI: 42.3–69.7) and 78.9% (95%CI: 67.6–87.7), respectively, and a Youden index J was 0.352. The diagnostic performance of serum MUC16 in distinguishing between BEOTs and MEOTs was also analyzed, with an AUC of 0.957 (95%CI: 0.905–0.985; p < 0.001) and a cut‐off value of 75 U/mL. The sensitivity was 83.64% (71.2 to 92.2) and the specificity was 100% (94.9–100), with a Youden index J of 0.836. Significantly noteworthy, in pairwise comparisons, MUC16 demonstrated a markedly improved discriminatory capacity compared to MUC1, MUC13, and ADC (all p < 0.05), distinguishing malignant epithelial ovarian tumors. The serum biomarkers (MUC1, MUC13, and MUC16) and ADC mean have a combined diagnostic value for distinguishing between BEOTs and MEOTs, with an AUC of 0.995 (95%CI: 0.962–1.000, p < 0.001), a sensitivity of 96.4% (87.5–99.6), and a specificity of 100% (94.9–100).
FIGURE 3.

Receiver Operating Characteristic (ROC) curve analysis evaluating the diagnostic efficacy of serum levels of MUCs (MUC1, MUC13, and MUC16), apparent diffusion coefficient (ADC)mean, and their combination in distinguishing between borderline epithelial ovarian tumors (BEOTs) and malignant epithelial ovarian tumors (MEOTs).
TABLE 2.
Serum levels of Mucin 1 (MUC1), MUC13, and MUC16 were assessed for their diagnostic performance in discriminating between borderline epithelial ovarian tumors (BEOTs) or malignant epithelial ovarian tumors (MEOTs).
| Factors | AUC (95% CI) | Cut‐off Value | Sensitivity (95% CI) | Specificity (95% CI) |
|---|---|---|---|---|
| ADCmean | 0.757 (0.673–0.829) | 1.381 × 103 mm2/s | 63.6% (49.6%–76.2%) | 90.1% (80.7%–95.9%) |
| Serum MUC1 | 0.723 (0.636–0.799) | 159.2 U/mL | 50.9% (37.1%–64.6%) | 100% (94.9%–100.0%) |
| Serum MUC13 | 0.656 (0.566–0.738) | 11.52 ng/mL | 56.4% (42.3%–69.7%) | 78.9% (67.6%–87.7%) |
| Serum MUC16 | 0.957 (0.905–0.985) | 75 U/mL | 83.64% (71.2%–92.2%) | 100% (94.9%–100.0%) |
| Combined Biomarkers | 0.995 (0.962–1.000) | – | 96.4% (87.5%–99.6%) | 100% (94.9%–100.0%) |
Note: Area Under the Curve (AUC); 95% Confidence Interval (95% CI).
4. DISCUSSION
In the context of our study, our objectives were to assess the diagnostic effectiveness of merging DWI with serum markers MUC1, MUC13, and MUC16 to differentiate between BEOTs and MEOTs. This led us to address the following key research inquiries: Firstly, how does the DWI in the discrimination of BEOTs from MEOTs? Secondly, what are the individual accuracies of each serum marker (MUC1, MUC13, and MUC16) in discriminating BEOTs and MEOTs? Lastly, we sought to determine the potential incremental value of integrating these serum markers with DWI in elevating the diagnostic precision for classifying BEOTs and MEOTs. By investigating these specific aims, we aimed to shed light on the practical implications of this combined diagnostic strategy and its potential to enhance the accuracy of epithelial ovarian tumor classification.
DWI‐MRI is a non‐invasive imaging technique that can be used to detect and characterize ovarian tumors. 7 , 24 Li et al. conducted a study to compare the performance of single‐parameter MR imaging and multiparameter models in differentiating borderline from malignant epithelial ovarian tumors. 9 The study found that the ADC‐based model demonstrated the best overall differentiation performance among the single‐parameter MR models. Moreover, the performance of the ADC‐based model was comparable to that of the multiparameter models. We found a lower ADC value in the patients with MEOTs compared to those patients with BEOTs. Besides, the diagnostic performance analysis resulted in an AUC of 0.757 with a sensitivity of 76.06% and a specificity of 70.91%. Similarly, a previous study reported that ADC values were significantly higher in BEOTs than in MEOTs, with a sensitivity, specificity, and accuracy of 88.2%, 88.6%, and 88.5% for ADC values, respectively. 25 This suggests that while ADC value may aid in differentiating between borderline and malignant ovarian tumors, it should not be solely relied upon for diagnosis.
The glycoprotein MUC1 is frequently found to be overexpressed in various types of epithelial cancers, including ovarian cancer. 26 In our study, we also observed a significant increase in the levels of MUC1 in patients with MEOTs as compared to those with BEOTs. However, it was important to note that MUC1 was not specific to ovarian cancer, which could also be elevated in other types of cancer, such as pancreatic cancer 27 and breast cancer. 28 Our study did find that MUC1 levels can be used to differentiate between benign and malignant ovarian tumors, with a determined cut‐off value of 114.8 U/mL and an AUC of 0.722. However, the sensitivity and specificity of this cut‐off value were found to be 76.06% and 65.45%, respectively. In addition to MUC1, other members of the MUC family, including MUC13 and MUC16, have also been investigated for their potential diagnostic value in EOC. 1 , 29 , 30 The serum level of MUC16 showed significant differences between BEOTs and MEOTs, being consistent with our results. 8 , 31 Moreover, MUC13 was found to be significantly higher in cancer samples compared to normal tissues and specifically present in EOC. 32 A study by Ren et al. found that the levels of MUC13 and MUC16 in the serum were found to be higher in cases of malignant ovarian cancer as compared to benign cases, and both MUC13 and CA125 had similar AUC values of 0.74 and 0.76, respectively. These findings suggest that MUC13 could be used as a supplementary biomarker to CA125 in the detection of certain subtypes of non‐serous ovarian carcinoma and the early detection of ovarian cancer. 20 We analyzed the diagnostic performance of serum MUC13 and MUC16 in distinguishing between BEOTs and MEOTs. Serum MUC13 showed an AUC of 0.656 (cut‐off value: 11.59 ng/mL, sensitivity: 78.87%, specificity: 56.36%), while serum MUC16 had an AUC of 0.956 (cut‐off value: 42.6 U/mL, sensitivity: 61.97%, specificity: 98.18%).
The combination of serum biomarkers and DWI‐MRI may improve the accuracy and sensitivity of cancer diagnosis and prognosis. For example, The ADC values combined with serum AFP‐L3 detection had good predictive effects on complete ablation and recurrence of liver cancer after percutaneous radiofrequency ablation with a sensitivity of 92.86% and a specificity of 69.62%. 33 Besides, ADC value combined with serum tumor markers ALP and TSGF is reliable in evaluating the curative effect of neoadjuvant chemotherapy for osteosarcoma. 34 Worth mentioning, one study by Wang N et al. analyzed the value of serum platelet/lymphocyte ratio (PLR), MUC16, and DWI in the diagnosis of recurrent ovarian cancer. The study found that the combination of serum MUC16 and PLR levels with DWI‐MRI had a higher diagnostic accuracy than either method alone. 14 In present study, the serum biomarkers (MUC1, MUC13, and MUC16) and ADC mean have a combined diagnostic value for distinguishing between BEOTs and MEOTs, with an area under the curve (AUC) of 0.995 (95%CI: 0.988–1.000, p < 0.001), a sensitivity of 90.14% (80.74%–95.94%), and a specificity of 98.18% (90.28%–99.95%). These findings indicated that the combination of these biomarkers with DWI provides a strong diagnostic capability for distinguishing between BEOTs and MEOTs.
However, limitations also exist within this diagnostic approach. Firstly, we acknowledge the influence of the coronavirus disease 2019 pandemic on our research activities, which spanned both pre‐pandemic and pandemic periods. The pandemic introduced unforeseen challenges, potentially impacting aspects such as personnel allocation, research recruitment, and overall research operations. Despite these disruptions, we maintained consistent participation from experienced radiologists, ensuring the study's scientific rigor and reliability. Furthermore, we recognized the limitation of including patients exclusively from a single hospital within a specific timeframe, which could introduce selection bias and constrain the generalizability of our conclusions. This limitation arose due to practical constraints, including time and funding. We also acknowledged the potential impact of specific histological subtypes within the heterogeneous “malignant” subgroup and their morphology on ADC measurements. Unfortunately, due to sample size and resource limitations, we were unable to explore these subtypes in detail, but we have highlighted this as an avenue for future research. The relatively small sample size of our study was noted, with an awareness of the increased risk of bias or random error in the outcomes. We advise cautious interpretation of our findings and suggest that further research with a larger sample size may be needed to validate the results. Additionally, we emphasized the potential barriers related to the cost and accessibility of DWI‐MRI, which could limit its widespread implementation. Furthermore, we acknowledged that the combined use of the three biomarkers and DWI‐MRI may not exhibit efficacy in all instances of ovarian cancer, as some cases may not overexpress all three markers or exhibit substantial alterations in tissue cellularity. Lastly, we acknowledged the potential importance of age in the classification of ovarian tumors, although it was not included in our algorithm. Future research could explore how age interacts with other factors and its potential impact on tumor classification.
In conclusion, this study provided clinically relevant interpretations for diagnosing borderline from malignant epithelial ovarian tumors based on multiple biomarkers and imaging parameters. An ADC mean value below 1.381 × 103 mm2/s signified a higher likelihood of malignancy, while serum MUC1 levels exceeding 159.2 U/mL strongly indicated malignancy with high specificity. Elevated serum MUC13 levels (above 11.52 ng/mL) suggested potential malignancy, though with lower specificity, and serum MUC16 levels exceeding 75 U/mL were highly indicative of malignancy, offering exceptional diagnostic confidence. When these biomarkers collectively indicated malignancy, the probability of malignancy was extremely high. However, it is essential to emphasize that these markers should be considered alongside other clinical and imaging findings for a comprehensive and accurate ovarian tumor diagnosis, ultimately improving patient care and management.
CONFLICT OF INTEREST STATEMENT
The authors declare no conflict of interest.
FUNDING INFORMATION
Not applicable.
ETHICS STATEMENT
Prior to using their biological material for scientific purposes, all patients provided informed consent in accordance with the regulations set forth by the ethics committees of PingYang People's Hospital.
Supporting information
Supporting Information
Supporting Information
ACKNOWLEDGMENTS
Not applicable.
Wen XT, Qiu HF, Ying LL, Huang M, Xiao YZ, Fan CC. Diagnostic efficacy of combining diffusion‐weighted magnetic resonance imaging with serum Mucin 1, Mucin 13, and Mucin 16 in distinguishing borderline from malignant epithelial ovarian tumors. Asia-Pac J Clin Oncol. 2025;21:115–122. 10.1111/ajco.14045
DATA AVAILABILITY STATEMENT
The datasets used and/or analyzed during the current study are available from the corresponding author upon reasonable request.
REFERENCES
- 1. Alegria‐Banos JA, Jimenez‐Lopez JC, Vergara‐Castaneda A, et al. Kinetics of HE4 and CA125 as prognosis biomarkers during neoadjuvant chemotherapy in advanced epithelial ovarian cancer. J Ovarian Res. 2021;14:96. [DOI] [PMC free article] [PubMed] [Google Scholar]
- 2. Sung H, Ferlay J, Siegel RL, et al. Global cancer statistics 2020: GLOBOCAN estimates of incidence and mortality worldwide for 36 cancers in 185 countries. CA Cancer J Clin. 2021;71:209‐249. [DOI] [PubMed] [Google Scholar]
- 3. Ferlay J, Colombet M, Soerjomataram I, et al. Cancer statistics for the year 2020: an overview. Int J Cancer. Published online: Apr 5, 2021. [DOI] [PubMed] [Google Scholar]
- 4. Lu J, Pi S, Ma FH, et al. Value of normalized apparent diffusion coefficients in differentiating between borderline and malignant epithelial ovarian tumors. Eur J Radiol. 2019;118:44‐50. [DOI] [PubMed] [Google Scholar]
- 5. Jankowska‐Lombarska M, Grabowska‐Derlatka L, Derlatka P. Tumor‐bowel fistula as a rare form of recurrent ovarian cancer‐imaging and treatment: preliminary report. Curr Oncol. 2022;30:506‐517. [DOI] [PMC free article] [PubMed] [Google Scholar]
- 6. Fischerova D, Pinto P, Burgetova A, et al. Preoperative staging of ovarian cancer: comparison between ultrasound, CT and whole‐body diffusion‐weighted MRI (ISAAC study). Ultrasound Obstet Gynecol. 2022;59:248‐262. [DOI] [PubMed] [Google Scholar]
- 7. Gagliardi T, Adejolu M, deSouza NM. Diffusion‐weighted magnetic resonance imaging in ovarian cancer: exploiting strengths and understanding limitations. J Clin Med. 2022;11. [DOI] [PMC free article] [PubMed] [Google Scholar]
- 8. Xiao F, Zhang L, Yang S, Peng K, Hua T, Tang G. Quantitative analysis of the MRI features in the differentiation of benign, borderline, and malignant epithelial ovarian tumors. J Ovarian Res. 2022;15:13. [DOI] [PMC free article] [PubMed] [Google Scholar]
- 9. Li Y, Jian J, Pickhardt PJ, et al. MRI‐based machine learning for differentiating borderline from malignant epithelial ovarian tumors: a multicenter study. J Magn Reson Imaging. 2020;52:897‐904. [DOI] [PubMed] [Google Scholar]
- 10. Derlatka P, Grabowska‐Derlatka L, Halaburda‐Rola M, Szeszkowski W, Czajkowski K. The value of magnetic resonance diffusion‐weighted imaging and dynamic contrast enhancement in the diagnosis and prognosis of treatment response in patients with epithelial serous ovarian cancer. Cancers. 2022;14:2464 [DOI] [PMC free article] [PubMed] [Google Scholar]
- 11. Zhang J, Huang Y, Chen J, Wang X, Ma H. Potential of combination of DCE‐MRI and DWI with serum CA125 and CA199 in evaluating effectiveness of neoadjuvant chemotherapy in breast cancer. World J Surg Oncol. 2021;19:284. [DOI] [PMC free article] [PubMed] [Google Scholar]
- 12. Li M, Zheng G, Yu L, et al. Diagnostic value of MRI‐DWI signal intensity value combined with serum PGI, PGII and CA199 in early gastric cancer. Cell Mol Biol (Noisy‐le‐grand). 2021;67:95‐100. [DOI] [PubMed] [Google Scholar]
- 13. Zhang G, Yao W, Sun T, et al. Magnetic resonance imaging in categorization of ovarian epithelial cancer and survival analysis with focus on apparent diffusion coefficient value: correlation with Ki‐67 expression and serum cancer antigen‐125 level. J Ovarian Res. 2019;12:59. [DOI] [PMC free article] [PubMed] [Google Scholar]
- 14. Wang N, Li C, Yang Y, et al. The use of platelet/lymphocyte ratio and cancer antigen 125 combined with magnetic resonance diffusion‐weighted imaging in diagnosis of recurrent ovarian cancer and neuropathic pain. World Neurosurg. 2021;149:502‐510. [DOI] [PubMed] [Google Scholar]
- 15. Budiu RA, Mantia‐Smaldone G, Elishaev E, et al. Soluble MUC1 and serum MUC1‐specific antibodies are potential prognostic biomarkers for platinum‐resistant ovarian cancer. Cancer Immunol Immunother. 2011;60:975‐984. [DOI] [PMC free article] [PubMed] [Google Scholar]
- 16. Bafna S, Kaur S, Batra SK. Membrane‐bound mucins: the mechanistic basis for alterations in the growth and survival of cancer cells. Oncogene. 2010;29:2893‐2904. [DOI] [PMC free article] [PubMed] [Google Scholar]
- 17. Li X, Xu Y, Zhang L. Serum CA153 as biomarker for cancer and noncancer diseases. Prog Mol Biol Transl Sci. 2019;162:265‐276. [DOI] [PubMed] [Google Scholar]
- 18. Ghaemmaghami F, Akhavan S. Is postoperative CA125 level in patients with epithelial ovarian cancer reliable to guess the optimality of surgery? Eur J Gynaecol Oncol. 2011;32:192‐195. [PubMed] [Google Scholar]
- 19. Funston G, Mounce LT, Price S, et al. CA125 test result, test‐to‐diagnosis interval, and stage in ovarian cancer at diagnosis: a retrospective cohort study using electronic health records. Br J Gen Pract. 2021;71:e465‐e472. [DOI] [PMC free article] [PubMed] [Google Scholar]
- 20. Ren AH, Filippou PS, Soosaipillai A, et al. Mucin 13 (MUC13) as a candidate biomarker for ovarian cancer detection: potential to complement CA125 in detecting non‐serous subtypes. Clin Chem Lab Med. 2023;61:464‐472. [DOI] [PubMed] [Google Scholar]
- 21. Song XL, Wang L, Ren H, Wei R, Ren JL, Niu J. Intravoxel incoherent motion imaging in differentiation borderline from malignant ovarian epithelial tumors: correlation with histological cell proliferation and vessel characteristics. J Magn Reson Imaging. 2020;51:928‐935. [DOI] [PubMed] [Google Scholar]
- 22. Denewar FA, Takeuchi M, Urano M, et al. Multiparametric MRI for differentiation of borderline ovarian tumors from stage I malignant epithelial ovarian tumors using multivariate logistic regression analysis. Eur J Radiol. 2017;91:116‐123. [DOI] [PubMed] [Google Scholar]
- 23. Fluss R, Faraggi D, Reiser B. Estimation of the Youden Index and its associated cutoff point. Biom J. 2005;47:458‐472. [DOI] [PubMed] [Google Scholar]
- 24. Liu X, Wang T, Wang Y, et al. Histogram analysis of apparent diffusion coefficient on diffusion weighted magnetic resonance imaging in differentiation between low and high grade serous ovarian cancer. Curr Med Imaging. 2023;19:167‐174 [DOI] [PubMed] [Google Scholar]
- 25. Li HM, Zhao SH, Qiang JW, et al. Diffusion kurtosis imaging for differentiating borderline from malignant epithelial ovarian tumors: a correlation with Ki‐67 expression. J Magn Reson Imaging. 2017;46:1499‐1506. [DOI] [PubMed] [Google Scholar]
- 26. Oei AL, Moreno M, Verheijen RH, et al. Induction of IgG antibodies to MUC1 and survival in patients with epithelial ovarian cancer. Int J Cancer. 2008;123:1848‐1853. [DOI] [PubMed] [Google Scholar]
- 27. Gold DV, Modrak DE, Ying Z, Cardillo TM, Sharkey RM, Goldenberg DM. New MUC1 serum immunoassay differentiates pancreatic cancer from pancreatitis. J Clin Oncol. 2006;24:252‐258. [DOI] [PubMed] [Google Scholar]
- 28. Croce MV, Isla‐Larrain MT, Demichelis SO, Gori JR, Price MR, Segal‐Eiras A. Tissue and serum MUC1 mucin detection in breast cancer patients. Breast Cancer Res Treat. 2003;81:195‐207. [DOI] [PubMed] [Google Scholar]
- 29. Boland JL, Zhou Q, Iasonos AE, et al. Utility of serum CA‐125 monitoring in patients with ovarian cancer undergoing immune checkpoint inhibitor therapy. Gynecol Oncol. 2020;158:303‐308. [DOI] [PMC free article] [PubMed] [Google Scholar]
- 30. Filippou PS, Ren AH, Korbakis D, et al. Exploring the potential of mucin 13 (MUC13) as a biomarker for carcinomas and other diseases. Clin Chem Lab Med. 2018;56:1945‐1953. [DOI] [PubMed] [Google Scholar]
- 31. Huang K, Xu S, Wang J, Ge L, Xu J, Jia X. Combined use of CA125, neutrophil/lymphocyte ratio and platelet/lymphocyte ratio for the diagnosis of borderline and malignant epithelial ovarian tumors. J Ovarian Res. 2023;16:37. [DOI] [PMC free article] [PubMed] [Google Scholar]
- 32. Chauhan SC, Vannatta K, Ebeling MC, et al. Expression and functions of transmembrane mucin MUC13 in ovarian cancer. Cancer Res. 2009;69:765‐774. [DOI] [PubMed] [Google Scholar]
- 33. Zhang G, Yun Y, Lin C, Li H. Predictive value of MRI with serum lectin‐reactive alpha‐fetoprotein for liver cancer recurrence after percutaneous radiofrequency ablation. Evid Based Complement Alternat Med. 2022;. 2022:5132135. [DOI] [PMC free article] [PubMed] [Google Scholar] [Retracted]
- 34. Wang Z, Liu L, Song YX, Zhang H, She W, Qian YW. [Application of apparent diffusion coefficient combined with serum tumor markers detection in evaluating neoadjuvant chemotherapy for osteosarcoma]. Zhonghua Yi Xue Za Zhi. 2020;100:1012‐1016. [DOI] [PubMed] [Google Scholar]
Associated Data
This section collects any data citations, data availability statements, or supplementary materials included in this article.
Supplementary Materials
Supporting Information
Supporting Information
Data Availability Statement
The datasets used and/or analyzed during the current study are available from the corresponding author upon reasonable request.