

Abstract
The N6-methyladenosine (m6A) modification serves as an essential epigenetic regulator in eukaryotic cells, playing a significant role in tumorigenesis and cancer progression. However, the detailed biological functions and underlying mechanisms of m6A regulation in gastric cancer (GC) are poorly understood. Our research revealed that the m6A demethylase ALKBH5 was markedly downregulated in GC tissues, which was associated with poor patient prognosis. Functional studies demonstrated that suppressing ALKBH5 expression enhanced GC cell proliferation, migration, and invasion. Mechanistically, ALKBH5 removed m6A modifications from the 5’ uncapped and polyadenylated transcripts (UPTs) of WRAP53. This demethylation decreased WRAP53 stability and translation efficiency. The lower level of WRAP53 disrupts the interaction between USP6 and RALBP1 protein, promoting RALBP1 degradation and thereby suppressing the PI3K/Akt/mTOR signaling cascade, ultimately attenuating the progression of GC. These findings highlight the pivotal role of ALKBH5-mediated m6A demethylation in inhibiting GC progression and the potential role of ALKBH5 as a promising biomarker and therapeutic target for GC intervention.
Supplementary Information
The online version contains supplementary material available at 10.1186/s12943-024-02223-4.
Keywords: Gastric cancer, Metastasis, ALKBH5, M6A, WRAP53
Introduction
Gastric cancer (GC) ranks fifth in terms of both incidence and mortality worldwide, with over 968,000 new cases and nearly 660,000 deaths reported in 2022 [1]. Patients are frequently diagnosed at advanced stages due to the subtle nature of early symptoms, and the prognosis for those with advanced GC remains poor, despite progress in treatment strategies [2, 3]. Consequently, there is an urgent need to elucidate the mechanism underlying GC growth and metastasis and discover biomarkers for early diagnosis to facilitate the development of specific therapeutic strategies against GC.
Epigenetic modifications, including DNA methylation, histone modification, chromatin remodeling, and RNA modifications, are heritable changes that alter gene function and phenotype without altering the DNA sequence, playing crucial roles in cellular functions, embryonic development, and genomic imprinting [4, 5]. Emerging evidence highlights that epigenetic dysregulation significantly contributes to cancer onset and progression [6, 7]. The most prevalent post-transcriptional RNA methylation, N6-methyladenosine (m6A), is primarily found within the RRACH (R = A/G and H = A/C/U) sequence, with most sites located around stop codons, at 3′ UTRs, and in long internal exons [8]. This modification, catalyzed by methyltransferase complexes (or “writers”) such as methyltransferase-like 3/14 (METTL3/14), Wilms tumor 1-associated protein (WTAP), and Vir-like m6A methyltransferase associated (VIRMA), involves methylation of the nitrogen-6 position of adenosine. m6A demethylases (or “erasers”), including AlkB homolog 5 (ALKBH5) and fat mass and obesity-associated (FTO), selectively remove this methylation, making m6A modification dynamic and reversible. In addition, m6A “readers”, which are RNA-binding proteins such as YTH domain-containing (YTHDC) proteins, insulin-like growth factor 2 mRNA-binding protein (IGF2BP) family, and eukaryotic initiation factor 3 (eIF3), recognize and selectively bind to m6A sites, directing the fate of the target RNA. Generally, m6A modification fine-tunes RNA structure and plays a critical role in regulating transcript stability, alternative splicing, subcellular localization, and translation [9–11].
For most eukaryotic mRNAs, translation initiation relies on the recognition of the 5’CAP, a 7-methylguanosine (m7G) modification generated by the eukaryotic initiation factor 4E (eIF4E) [12]. In different biological contexts, cells can use m6A-mediated pathways for protein production in a 5’ CAP-independent manner, with the location of m6A determining the specific pathway. When m6A is located in the 3’ UTR, it facilitates the binding of YTHDF1 or YTHDF3 proteins, thereby enhancing translation efficiency. Conversely, when m6A is situated within the 5’ UTR, it enables eIF3 to recruit the 43 S translation initiation complex, driving translation, particularly under cellular stress conditions [13]. Intriguingly, recent studies identified the previously undescribed 5’ uncapped and 3’ polyadenylated transcripts (5’ UPTs) emerging downstream of alternative cleavage and polyadenylation (APA) sites within their host genes, which are induced following APA activation [14]. 5’ UPTs exhibit increased stability due to secondary RNA structures at their 5’ ends which protect them from degradation by endogenous RNA exonucleases. Additionally, they are marked by m6A modifications at their 5’ termini facilitate translation initiation.
Recent studies have identified abnormal m6A regulation as a key factor in the progression of various cancers. For example, m6A hypomethylation inhibits the degradation of FGFR4 mRNA, upregulates FGFR4 expression, and ultimately leads to activation of the β-catenin/TCF4 signaling pathway, transmitting anti-HER2 resistance in breast cancer [15]. Similarly, VIRMA upregulates E2F7 expression via an m6A-dependent mechanism, driving nasopharyngeal carcinoma progression [16]. Especially, the m6A demethylase ALKBH5 was verified to play a vital role in various tumor suppressive processed in an m6A-dependent manner [17]. While these findings highlight the significant role of m6A modulators on gene regulation during tumorigenesis and cancer progression, their specific functions and regulatory mechanisms in GC remain largely unknown.
Here, we explored the function and mechanisms of ALKBH5 in GC. Our findings indicated that ALKBH5 is downregulated in GC and correlates with adverse prognosis of GC patients. ALKBH5 inhibits GC cell proliferation, migration, and invasion both in vitro and in vivo. Further analysis reveals that ALKBH5 removes m6A modifications from the 5’ UPTs of WRAP53, resulting in decreased translation of WRAP53, which has never been reported yet. WRAP53 encodes a vital component of the telomerase holoenzyme complex [18]. It mainly serves as a tumor-promoting gene by mediating protein-protein interaction and participating in cellular processes such as cell cycle and apoptosis, cell cycle regulation, protein degradation and signal transduction [19–21]. However, the role of WRAP53 in GC remains unclear. In this study, we show that the decrease in WRAP53 expression diminishes its function as a scaffold for the interaction between RALBP1 and USP6, resulting in increased degradation of RALBP1 and subsequently suppressing gastric cancer growth and metastasis. Our findings emphasize the significant role of ALKBH5 in GC and suggest its potential as both a biomarker and a therapeutic target.
Results
ALKBH5 is downregulated and correlates with a favorable prognosis in GC
To investigate the potential role of m6A eraser ALKBH5 in GC, we first detected the mRNA levels of ALKBH5 in GC (n = 43) and normal gastric tissues (n = 20) using qPCR. As shown in Fig. 1A, ALKBH5 expression was decreased in tumor tissues compared with that in normal tissues (upper panel, P < 0.01). Moreover, ALKBH5 protein levels were significantly decreased in the other four pairs of GC and normal tissues (Fig. 1A, lower panel). Similarly, the mRNA and protein levels of ALKBH5 were significantly downregulated in seven gastric cancer cell lines (SNU-216, MKN28, SGC7901, MKN45, HGC27, MKN74, and AGS) compared to the immortalized normal gastric epithelial cell line GES-1 (Fig. 1B). Collectively, these results revealed that ALKBH5 is downregulated in GC tissues and cell lines.
Fig. 1.

ALKBH5 is downregulated in GC and correlates with favorable prognosis. A The relative expression of ALKBH5 was detected using qPCR (upper panel) or western blotting (lower panel) and normalized to GAPDH or α-tubulin. B The relative expression of ALKBH5 in GC cell lines (SNU-216, MKN28, SGC7901, MKN45, HGC27, MKN74, AGS) and immortalized gastric epidermal cells (GES-1) detected using qPCR (upper panel) or western blotting (lower panel). C‒G The prognostic value of ALKBH6 in GC was assessed by IHC staining in the GC cohort (n = 310). The expression level of ALKBH5 was measured using the immunoactivity score (IRS) system. C Two examples of the assigned IRS result are provided, with designations of 0–6 as low ALKBH5 expression (n = 168) and 7–12 as high ALKBH5 expression (n = 142). Scale bar: 50 μm. D The distribution of ALKBH5 IRS in the GC cohort (n = 310). E-F Kaplan-Meier analysis of OS (E) and DFS (F) in high vs. low ALKBH5 expression groups. G Multivariate analysis of OS based on clinical prognostic parameters and ALKBH5 expression of patients in the GC cohort (n = 310). H Time-dependent ROC curves showing the prognostic value of TNM staging, ALKBH5 expression, and their combination in the GC cohort (n = 310). **P < 0.01
We subsequently analyzed the clinical significance of ALKBH5 in a cohort of GC samples (n = 310) who were treatment naive. Immunohistochemistry (IHC) staining was performed to assess the ALKBH5 protein expression. Patients with GC were stratified by their median ALKBH5 immunoactivity score into low and high-expression groups (Fig. 1C, D). We observed that patients with high ALKBH5 expression were less likely to experience progression and metastasis (Table 1). Furthermore, Kaplan–Meier analysis indicated that high ALKBH5 expression was significantly associated with improved overall and disease-free survival (Fig. 1E, F, all P < 0.001). Multivariable Cox regression analysis revealed that ALKBH5 expression and TNM stage were independent prognostic factors for patients with GC (Fig. 1G, both P < 0.05). To further evaluate the prognostic value of ALKBH5 expression, we conducted a time-dependent receiver operating characteristics (ROC) curve analysis, in which the TNM stage and ALKBH5 expression were used separately or in combination. As shown in Fig. 1H, the integrated model had a higher accuracy for prognostic evaluation than either the TNM stage or ALKBH5 expression alone. Collectively, these results suggested that ALKBH5 is a promising biomarker for GC.
Table 1.
Clinical characteristics of nasopharyngeal carcinoma patients according to the high and low expression of ALKBH5
| Characteristics | No. of patients | ALKBH5 expression | P value | |
|---|---|---|---|---|
| Low, n (%) | High, n (%) | |||
| Age | ||||
| < 65 | 143 | 78 (46.4%) | 65 (45.8%) | 0.908 |
| ≥ 65 | 167 | 90 (53.6%) | 77 (54.2%) | |
| Gender | ||||
| Female | 223 | 121 (72.0%) | 102 (71.8%) | 0.970 |
| Male | 87 | 47 (28.0%) | 40 (28.2%) | |
| Position | ||||
| Gastric | 232 | 128 (76.2%) | 104 (73.2%) | 0.551 |
| Esophageal–gastric junction | 78 | 40 (23.8%) | 38 (26.8%) | |
| Lauren | ||||
| Diffuse | 38 | 22 (13.1%) | 16 (11.3%) | 0.625 |
| Non-diffuse | 272 | 146 (86.9%) | 126 (88.7%) | |
| MMR | ||||
| pMMR | 266 | 144 (85.7%) | 122 (85.9%) | 0.960 |
| dMMR | 44 | 24 (14.3%) | 20 (14.1%) | |
| Differentiation | ||||
| Medium-low | 241 | 135 (80.4%) | 106 (74.6%) | 0.229 |
| Medium-high | 69 | 33 (19.6%) | 36 (25.4%) | |
| HER-2 | ||||
| Positive | 218 | 126 (75.0%) | 92 (64.8%) | 0.050 |
| Negative | 92 | 42 (25.0%) | 50 (35.2%) | |
| T Stage | ||||
| T1-2 | 53 | 20 (11.9%) | 33 (23.2%) | 0.008 |
| T3-4 | 257 | 148 (88.1%) | 109 (76.8%) | |
| N Stage | ||||
| N0-N1 | 133 | 64 (38.1%) | 69 (48.6%) | 0.063 |
| N2-N3 | 177 | 104 (61.9%) | 73 (51.4%) | |
| TNM Stage | ||||
| I-II | 119 | 57 (33.9%) | 62 (43.7%) | 0.079 |
| III-IV | 191 | 111 (66.1%) | 80 (56.3%) | |
| Peritoneal metastasis | ||||
| Yes | 34 | 25 (14.9%) | 9 (6.3%) | 0.016 |
| No | 276 | 143 (85.1%) | 133 (93.7%) | |
| Locoregional failure | ||||
| Yes | 165 | 106 (63.1%) | 59 (41.5%) | 0.001 |
| No | 145 | 62 (36.9%) | 83 (58.5%) | |
| Death | ||||
| Yes | 140 | 97 (57.7%) | 43 (30.3%) | 0.001 |
| No | 170 | 71 (43.2%) | 99 (69.7%) | |
All patients were restaged according to the 8th edition of the AJCC Cancer Staging Manual. Bold values indicate P < 0.05, P value is determined by χ2 and Fisher’s exact tests
MMR Mis-match repair, pMMR proficiency of mismatch repair, dMMR deficiency of mis-match repair
ALKBH5 suppresses GC cell proliferation and metastasis in vitro and in vivo
To gain insight into the function of ALKBH5 in GC, we first conducted RNA-seq in AGS cells transfected with scrambled control or si-ALKBH5 1#. Then we carried out GO and KEGG analyses on the differentially expressed genes identified. The results showed that reduced ALKBH5 expression resulted in the upregulation of 669 genes and downregulation of 666 genes (Fig. 2A). Bioinformatics analysis showed that ALKBH5 expression was significantly associated with pathways involved in tumorigenesis, proliferation, and metastasis (Fig. 2B, P < 0.05). Additionally, gene set enrichment analysis (GSEA) using data from GSE236522 indicated that lower ALKBH5 expression correlates with gastric cancer tumorigenesis (Supplementary Figure S1). To further verify these findings, we overexpressed ALKBH5 within low-ALKBH5 cells HGC27 and MKN45 (Fig. 2B), and conducted CCK-8 and colony formation assays. We found that GC cells with ALKBH5 overexpression had significantly reduced proliferative capacity (Fig. 2D, E, all P < 0.01). Transwell migration and invasion assays revealed a substantial decrease in migratory and invasiveness capacity of cells in the ALKBH5 overexpression group compared to the control group (Fig. 2F, G, all P < 0.01). Furthermore, we examined whether the downregulation of ALKBH5 could promote gastric cancer cell progression. As expected, functional studies revealed that ALKBH5 knockdown led to increased cell proliferation, migration, and invasion (Fig. 2H-L, all P < 0.01) in AGS cells. To exclude potential false-positive results caused by off-target effects of siRNA, two independent sgRNAs (sg-ALKBH5 1# and 2#) were designed to knockout ALKBH5 in AGS cells, followed by restoration of its expression. In vitro functional assays were performed to evaluate the impact of ALKBH5 expression changes on cell proliferation, migration, and invasion capabilities (Supplementary Figure S2A‒D). Collectively, these findings suggested that ALKBH5 inhibited GC cell proliferation, migration, and invasion in vitro.
Fig. 2.

ALKBH5 suppresses GC cell proliferation, migration, and invasion in vitro. A ALKBH5 was knocked down in AGS cells using siRNA (si-ALKBH5 1#), followed by RNA-seq analysis to identify differentially expressed genes, which are displayed in a heatmap. B GO and KEGG pathway analysis of the differentially expressed genes revealed that ALKBH5 expression correlated positively with cancer-related pathways. C Overexpression of ALKBH5 in HGC27 and MKN45 cells was confirmed by qPCR and Western blotting. D‒E Cell proliferation was analyzed in HGC27 and MKN45 cells with or without ALKBH5 overexpression using CCK-8 (D) and colony formation (E) assays. F‒G Transwell migration and invasion assays were performed in HGC27 (F) and MKN45 (G) cells with or without ALKBH5 overexpression, with representative images (left panel) and statistical analysis (right panel) provided. Scale bar: 200 μm. H ALKBH5 knockdown in AGS cells was achieved with two independent siRNAs (si-ALKBH5 1# and 2#), and knockdown efficiency was verified by qPCR and Western blotting. I‒K Cell proliferation was analyzed in AGS cells with or without ALKBH5 knockdown using CCK-8 (I) and colony formation (J‒K) assays. L Transwell migration and invasion assays were performed in AGS cells with or without ALKBH5 knockdown, with representative images (left panel) and statistical analysis (right panel) provided. Scale bar: 200 μm. ** P < 0.01
To further assess the impact of ALKBH5 on the growth and metastasis of GC tumors in vivo, we established mice models for subcutaneous xenograft, lung metastasis, and inguinal lymph node metastasis. We infected HGC27 cells with either a control lentivirus or a lentivirus engineered to overexpress ALKBH5. Remarkably, xenografts formed by the ALKBH5-overexpressing cells exhibited significantly higher m6A level, slower growth and lower tumor weights compared to the control group (Fig. 3A-C, Supplementary Figure S3A-B, all P < 0.01). Both qPCR and IHC staining clearly demonstrated ALKBH5 overexpression in the xenograft that had received cells transduced with ALKBH5 overexpression lentiviral vector (Fig. 3D, E, all P < 0.01). Additionally, both macroscopic and microscopic evaluations showed that the number of lung metastatic tumors in the ALKBH5 overexpression group was considerably fewer than in the control group (Fig. 3F-H, all P < 0.01). Furthermore, ALKBH5 overexpression led to a less aggressive phenotype in the skin and muscle of primary footpad tumors (Fig. 3I-J). The size of metastatic inguinal lymph nodes in the ALKBH5 overexpression group was significantly smaller than in the control group (Fig. 3K, P < 0.01). Moreover, the incidence of metastatic inguinal lymph nodes was significantly reduced in the ALKBH5 overexpression group (Fig. 3L, M, P < 0.05). Collectively, these in vivo results indicated that ALKBH5 suppressed the aggressive phenotype of GC.
Fig. 3.

Overexpression of ALKBH5 impaired the invasion and metastasis of GCin vivo. A–E Subcutaneous xenograft tumor models were established by injecting HGC27 cells with stable ALKBH5 overexpression or control cells into nude mice (n = 6 per group). A Representative image of the xenograft tumors. B‒C Quantitative analysis of the tumor volumes (B) and tumor weights (C) of the xenografts. Tumor volume was compared at indicated time points and the tumor weight was measured at the endpoint. D The ALKBH5 expression of the xenograft tumors was assessed using qPCR. E Xenograft tumor sections were examined by IHC staining for ALKBH5 and WRAP53. F–H HGC27 cells, either with ALKBH5 overexpression or as controls, were injected into the tail veins of nude mice to establish lung metastasis models. F Representative macroscopic (upper panel) and microscopic (lower panel) images of lung tissues from mice in the control and ALKBH5 overexpression groups. G Count of visible metastatic nodules in the lungs. H Microscopic count of lung metastases. I–M. HGC27 cells, either with ALKBH5 overexpression or as controls, were transplanted into the footpad of nude mice to construct inguinal lymph node metastasis models. I Representative image of the footpad tumors and inguinal lymph nodes. (J) Representative images of microscopic primary footpad tumors showing tumor cells invasion into skin and muscle (arrows). Scale bar: 100 μm. K Quantitative measurement of inguinal lymph node volumes. L Representative images of IHC staining with pan-cytokeratin (Pan-CK) in inguinal lymph nodes. Keratin staining is negative in normal lymph nodes, but it is positive with GC metastasis. Scale bar: 100 μm. M Statistical analysis of Pan-CK positive inguinal lymph nodes. *P < 0.05, **P < 0.01
ALKBH5 downregulates WRAP53 expression in an m6A-dependent manner
As a key RNA demethylase, ALKBH5 functions by removing m6A modifications in mRNA and certain non-coding RNAs, thereby regulating their biogenesis, decay, and transport [22]. To explore how ALKBH5 inhibits the malignant phenotype of GC, m6A quantification assays were first performed in AGS cells, revealing increased global m6A levels in GC cells upon ALKBH5 silencing (Fig. 4A, all P < 0.01), and overexpression of ALKBH5 increased the overall m6A levels in HGC27 and MKN45 cells (Fig. 4A). To pinpoint the potential RNA targets of ALKBH5, transcriptome-wide m6A immunoprecipitation (MeRIP) was conducted in HGC27 cells with controlled or ALKBH5-overexpression and AGS cells with controlled or si-ALKBH5 (Fig. 4B). In both ALKBH5-overexpression and si-ALKBH5 group, an significant alteration in m6A modification was primarily detected in the 3’UTR and 5’UTR regions (Fig. 4C, Supplementary Figure S4A). The most common m6A modification motifs are shown in Fig. 4D. Furthermore, in the ALKBH5-overexpression group, 1,468 genes exhibited significantly decreased m6A modifications (Fig. 4E), whereas 449 genes showed increased m6A levels in the si-ALKBH5 group (Supplementary Figure S4B). The functional enrichment analysis (GO and KEGG) of m6A-modified genes revealed that changes in m6A levels, driven by alterations in ALKBH5 expression, are associated with the aberrant activation of cancer-related pathways (Fig. 4F, Supplementary Figure S4C).
Fig. 4.

ALKBH5 modulates WRAP53 expression in an m6A-dependent manner. A The effects of ALKBH5 overexpression and knockdown in GC cell lines on total RNA m6A levels were quantified using an ELISA-based m6A quantification assays. B Schematic diagram of the MeRIP-seq workflow. C Pie chart depicting the distribution of differential m6A modifications following ALKBH5 overexpression. D m6A modification motifs identified in HGC27 cells by MeRIP-seq. E Volcano plot showing the differentially modified genes after ALKBH5 overexpression, defined as those with P-value < 0.05 and |Log2(Fold change) | ≥ 1. F GO and KEGG pathways enrichment analysis of differentially m6A-modified genes identified by MeRIP-seq. G Intersection of genes with increased m6A modifications from MeRIP-seq and altered translation rates from Ribo-seq identified six genes, with WRAP53, CCDC88C, and NDUFB2 showing differential m6A modification in the 5’ UTR. H Western blotting analysis of WRAP53, CCDC88C, and NDUFB2 expression levels after ALKBH5 knockdown. I Translation rate of the WRAP53 gene as determined by Ribo-seq. J Differential m6A modification peaks in the 5’ UTR of WRAP53 identified by MeRIP-seq. K‒L Changes in m6A levels in the 5’ UTR of WRAP53 were measured by MeRIP-seq after ALKBH5 knockdown in AGS cells (K) and ALKBH5 overexpression in HGC27 cells (L). M HGC27 cells were transfected with plasmids containing the wild-type WRAP53 5’ UTR (WT), m6A site mutations (A-G or A-C mutations), or deletions of the m6A sites. MeRIP-qPCR was used to assess the differences in m6A modification levels following mutation or deletion of the m6A sites. N Western blotting analysis showing the expression levels of ALKBH5 and WRAP53 in control and ALKBH5 overexpression cells. *P < 0.05, **P < 0.01
To elucidate the connection between m6A modifications and protein translation, we conducted ribosomal sequencing (Ribo-seq). Specifically, we identified genes meeting the following criteria: (1) genes with increased m6A modification levels following ALKBH5 knockdown, (2) genes with decreased m6A modification levels following ALKBH5 overexpression, and (3) genes with altered translation efficiency after ALKBH5 knockdown, as determined by Ribo-seq. The intersection of these three datasets yielded three candidate genes: WRAP53, NDUFB2, and CFLAR (Fig. 4H). Previous studies on the translational regulation role of m6A have primarily focused on the 3’ UTR. It is generally accepted that in response to cellular stress, m6A modification increases in the 5’ UTRs to enhance mRNA translation [23]. The regulatory effects of 5’ UTR m6A modification on translation remained elusive. Therefore, we selected WRAP53 and NDUFB2 from 3 intersecting genes with differential m6A modification sites in the 5’UTR for further investigation. With ALKBH5 silencing, WRAP53 expression was significantly upregulated compared to the other two genes, making it the primary candidate for subsequent research (Fig. 4I). A substantial increase in both translation efficiency and 5’UTR m6A modification was observed the following ALKBH5 knockdown (Fig. 4J, K, P < 0.05). Consistently, MeRIP-seq confirmed that ALKBH5 reduced m6A modification in the 5’UTR of WRAP53 (Fig. 4L, M, all P < 0.01). To further confirm these data, we constructed wild-type and mutant WRAP53 vectors, whereas the adenine residues in the 5’UTR were substituted with guanine (A-G mut), cytosine (A-C mut), or deleted (A-Del). MeRIP-qPCR showed significantly decreased m6A levels on WRAP53 mutant transcripts compared to the wild-type, indicating that the m6A motifs within the 5’UTR are essential for WRAP53 m6A modification (Fig. 4N, all P < 0.01). Moreover, both in vivo and in vitro overexpression of ALKBH5 significantly downregulated WRAP53 expression (Figs. 3E and 4O). Taken together, our findings demonstrated that ALKBH5 downregulates WRAP53 expression in an m6A-dependent manner, where the 5’UTR m6A modification sites are critical for this regulation.
m6A modifications promote the translation of 5’UPT RNA isoforms of WRAP53
Analyses of the DNA sequence of WRAP53 using the Ensemble database (https://useast.ensembl.org/index.html) revealed that its 5’UTR contains an APA (AATAAA) site and m6A sites (RRACH) upstream of the start codon (Fig. 5A). Generally, the transcribed mRNA is cleaved at the APA sites to generate a capped upstream isoform and an uncapped polyadenylated downstream isoform that is sensitive to TEX treatment, a terminator 5’phosphate-dependent exonuclease extracted from bacteria that degrades uncapped RNA molecules (Fig. 5B). It was reported that APA activation can induce 5’ UPTs [14], which possess translation initiation potential and produce non-canonical proteins. To investigate WRAP53 RNA production downstream of the APA sites, we treated WRAP53 transcripts with TEX and designed specific primers for qPCR amplification targeting regions upstream and downstream of the APA sites in its 5’UTR (Fig. 5C). The results showed that transcripts downstream of the APA sites were significantly reduced after TEX treatment, indicating that 5’UPT is an isoform of WRAP53 transcripts (Fig. 5D, P < 0.01). Previous studies have suggested that 5’ UPTs are marked with m6A sites at their 5’ end [24]. To explore the role of the numerous m6A sites in the 5’ UPT, we knocked down ALKBH5 in AGS cells, which led to an upregulation of transcripts downstream of the APA sites, while overexpression of ALKBH5 resulted in their downregulation (Fig. 5E-G, all P < 0.01). These results suggested that the APA and m6A sites in the 5’UTR of WRAP53 may regulate the expression of its 5’UPT.
Fig. 5.

m6A modification promotes the translation of 5’ UPTs of WRAP53. (A) A scheme showing the distribution of alternative polyadenylation (APA) and m6A modification sites in the 5’ UTR of WRAP53 transcripts. B A diagram illustrating mRNA post-transcriptional processing, where mRNA is cleaved at APA sites to produce upstream capped isoforms and downstream uncapped isoforms with polyadenylated 3’ ends, which are susceptible to TEX exonuclease degradation. C‒D. Design of qPCR primers upstream and downstream of the APA sites in WRAP53 transcripts (C) and quantitative analysis of different amplification sites before and after TEX treatment (D). E qPCR analysis of APA upstream and downstream expression in AGS cells after ALKBH5 knockdown. F RNA-seq read coverage showing WRAP53 expression in control and ALKBH5 knockdown cells. G qPCR analysis of APA upstream and downstream expression in HGC27 cells with ALKBH5 overexpression. H The full-length 5’ UTR of WRAP53 was cloned into a dual-luciferase vector, along with constructs for APA deletion, m6A deletion, and m6A mutation. I Each luciferase reporter construct was expressed in HGC27 cells, and qPCR was used to assess the expression levels upstream and downstream of the APA sites before and after TEX treatment. J qPCR analysis comparing APA upstream and downstream expression in full-length and m6A deletion groups before and after ALKBH5 knockdown. K Luciferase activity was measured in HGC27 cells transfected with each reporter construct. L Changes in luciferase activity were assessed in the full-length and m6A deletion groups following ALKBH5 knockdown. M Western blotting analysis was conducted to compare WRAP53 expression levels in three matched pairs of GC and normal gastric tissues. *P < 0.05, **P < 0.01
To further confirm these results, we cloned the entire 5’ UTR of WRAP53 upstream of the Renilla luciferase gene (Rluc) in a dual-luciferase reporter vector (pmirGLO) and integrated it into a fixed locus within HGC27 cells. As controls, we either deleted the APA sites or altered the single m6A site by deletion or mutation in the 5’UTR of the 5’UPT to assess the contribution of m6A to translation (Fig. 5H). Following TEX treatment of RNA extracts, qPCR analysis confirmed the expression of 5’UPT-Rluc in vectors containing the full WRAP53-5’UTR, as well as in those with m6A deletions or mutations (Fig. 5I, all P < 0.01). Conversely, deletion of the APA sites reduced the expression of 5’ UPT-Rluc, indicating the cleavage activity downstream of the APA region (Fig. 5I, P < 0.01). Additionally, knocking down ALKBH5 resulted in upregulated expression of 5’UPT-Rluc in the full 5’ UTR group (Fig. 5J, P < 0.01). Notably, cells transfected with the vector containing the full WRAP53-5’UTR exhibited strong luciferase activity, whereas loss of APA sites or alteration of m6A regions led to reduced luciferase expression (Fig. 5K, all P < 0.01). Furthermore, after ALKBH5 knockdown, luciferase activity was upregulated in the full 5’ UTR group (Fig. 5L, all P < 0.01). Intriguingly, elevated WRAP53 expression was observed in GC tissues compared to paired normal tissues (Fig. 5M, P < 0.01). Altogether, these findings pinpointed the pivotal role of m6A modification in regulating WRAP53-5’ UPT production and subsequent protein expression in GC.
WRAP53 upregulates RALBP1 by promoting USP6 and RALBP1 protein interaction
To better understand the function of the ALKBH5/WRAP53 axis in GC, we performed immunoprecipitation-mass spectrometry (IP-MS) analysis on WRAP53 to identify its interacting proteins (Supplementary Table S1). Among the highly abundant proteins, we identified RALBP1, a GSH-electrophile conjugate (GS-E) transporter found to enhance cancer cell proliferation and confer drug and radiation resistance [25] . Additionally, RALBP1 is an essential effector of p53, crucial for extensive cancer-promoting epigenetic remodeling [26]. Co-IP confirmed the interaction between WRAP53 and RALBP1 (Fig. 6A), and immunofluorescence assays revealed their co-localization in the cytoplasm (Fig. 6B). To investigate the role of the ALKBH5/WRAP53 axis on RALBP1, we overexpressed ALKBH5 in HGC27 cells and knocked down ALKBH5 in AGS cells. Western blotting results showed that ALKBH5 suppressed RALBP1 expression at the protein level (Fig. 6C, D), with no observable effect on its RNA levels (Fig. 6E. F). These results indicated that the ALKBH5/WRAP53 axis did not directly regulate RALBP1 transcription but rather modulate its protein degradation. To confirm this observation, we transfected AGS cells with control and si-ALKBH5 vectors and exposed them to cycloheximide (CHX) chase assay. The results showed that knocking down ALKBH5 significantly extended the half-life of the RALBP1 protein (Fig. 6G). Furthermore, we overexpressed ALKBH5 in HGC27 cells while either overexpressing WRAP53 or treating the cells with MG132. We observed that the inhibitory effect of ALKBH5 on RALBP1 protein levels was eliminated by the restoration of WRAP53 or the application of MG132 (Fig. 6H). These results suggested that WRAP53 upregulated RALBP1 by protecting it from proteasomal degradation.
Fig. 6.

WRAP53 enhances RALBP1 expression by facilitating USP6 and RALBP1 interaction. A Immunoprecipitation was performed using IgG control and anti-WRAP53 antibodies to detect the interaction between of WRAP53 and RALBP1. B Immunofluorescence staining of WRAP53 (red) and RALBP1 (green) in HGC27 cells illustrates their colocalization. C‒D Overexpression of ALKBH5 in HGC27 cells (C) and knockdown in AGS cells (D), with subsequent Western blotting analysis of ALKBH5, WRAP53, and RALBP1 expression levels. E‒F ALKBH5 overexpression in HGC27 cells (E) and knockdown in AGS cells (F) were conducted, with qPCR used to evaluate alterations in ALKBH5 and RALBP1 expression levels. G Control and si-ALKBH5-transfected AGS cells were exposed to cycloheximide (CHX, 50 µg/ml) for specified durations, and Western blotting was employed to evaluate the stability and half-life of RALBP1 protein. R²Scrambled = 0.981, R²si−ALKBH5 = 0.645. H Western blotting analysis of WRAP53 and RALBP1 levels in HGC27 cells overexpressing ALKBH5, treated with MG132 (10 mmol/L) for 24 h, or transfected with WRAP53 overexpression vectors. I‒J HA-tag RALBP1 (I) and HA-tag USP6 (J) were overexpressed along with a control vector in HGC27 cells, and Co-IP was performed using HA antibodies or IgG to assess protein interactions. K The interaction between RALBP1 and USP6 before and after ALKBH5 overexpression was assessed via immunoprecipitation with RALBP1 antibodies. L Immunofluorescence staining in HGC27 cells was used to evaluate the effect of WRAP53 knockdown on the interaction between USP6 (red) and RALBP1 (green). M Western blotting was performed to evaluate changes in USP6 and RALBP1 expression levels following USP6 knockdown in HGC27 cells. N‒O RALBP1 was immunoprecipitated after WRAP53 knockdown (N) or ALKBH5 overexpression (O), and its ubiquitination levels were examined using ubiquitin antibodies
While deubiquitylation shields ubiquitinated proteins from proteasomal degradation [27], WRAP53 lacks deubiquitylation activity. Therefore, we re-analyzed the mass spectrometry data and identified USP6, an oncogene that promotes cancer progression by deubiquitinating to activate cancer-related pathways such as Wnt/β-catenin and JAK1-STAT3 [28, 29]. We speculated that WRAP53 facilitates the binding of USP6 to RALBP1, allowing USP6 to deubiquitinate RALBP1 and protect it from degradation. Co-IP assays using HA-tag RALBP1 and HA-tag USP6 overexpression vectors confirmed the endogenous RALBP1-USP6 protein complex (Fig. 6I, J). Furthermore, IP assays showed that the binding of USP6 to RALBP1 decreased upon ALKBH5 overexpression (Fig. 6K). Additionally, immunofluorescence assays verified the co-localization of RALBP1 and USP6 in the cytoplasm, which was mitigated by WRAP53 silencing (Fig. 6L, Supplementary Figure S5A‒B). Consistent with these results we observed a decrease in RALBP1 protein levels when USP6 was knocked down (Fig. 6M, Supplementary Figure S6A). Meanwhile, knocking down WRAP53 (Supplementary Figure S6B) or overexpressing ALKBH5 significantly increased RALBP1 ubiquitination levels (Fig. 6N, O). Collectively, our results indicated that WRAP53 promoted the binding of USP6 to RALBP1, thereby upregulating RALBP1 expression. We further demonstrated that ALKBH5 acts as an upstream negative regulator in this pathway.
ALKBH5 suppresses GC progression by inhibiting RALBP1 expression
To determine whether ALKBH5 exerts its tumor-suppressive functions in GC by inhibiting RALBP1, we conducted in vitro functional rescue experiments by overexpressing ALKBH5 in cells with or without RALBP1 overexpression. Transwell migration and invasion assays showed that RALBP1 overexpression counteracted the suppressive effect of ALKBH5 on GC cell proliferation (Fig. 7A, B). Similar findings were obtained from CCK-8 and colony formation assays (Fig. 7C-G, all P < 0.01). The PI3K/Akt/mTOR pathway is commonly activated in human cancers, including GC, where Akt is phosphorylated (p-Akt) to initiate downstream signaling cascades [30, 31]. We observed an increase in p-PI3K, p-Akt (Ser308 and Ser473), and p-mTOR with RALBP1 overexpression. Conversely, decreases in p-PI3K, p-Akt, and p-mTOR were noted with ALKBH5 overexpression, which was abolished by restoring RALBP1 expression (Fig. 7H). Meanwhile, overexpression of ALKBH5 significantly mitigated RALBP1 expression in subcutaneous xenograft tumors (Fig. 7I). These findings suggest that ALKBH5 inhibits GC proliferation and metastasis by downregulating WRAP53, which in turn reduces the deubiquitylation activity of USP6 on RALBP1, leading to decreased RALBP1 expression and subsequent suppression of the PI3K/Akt/mTOR pathway (Fig. 8).
Fig. 7.

WRAP53 enhances RALBP1 expression by facilitating USP6 and RALBP1 interaction. A‒H HGC27 and MKN45 cells were transfected with overexpression plasmids for ALKBH5 and/or RALBP1, along with control plasmids. Transwell assays were used to assess changes in the migration and invasion capabilities of GC cells, with representative images (A) and statistical analysis (B) provided. CCK-8 assays evaluated the proliferation of HGC27 (C) and MKN45 (D) cells. Colony formation assays assessed the clonogenic potential of HGC27 (E) and MKN45 (F) cells, with statistical analysis shown (G). Western blotting was performed to measure the expression levels of ALKBH5, RALBP1, total PI3K (T-PI3K), and phosphorylated PI3K (p-PI3K), total Akt (T-Akt), and phosphorylated Akt (p-Akt-S308, p-Akt-S473), total mTOR (T- TOR), and phosphorylated TOR (p-TOR) in HGC27 cells (H). I Xenograft tumor sections in Vector and ALKBH5-overexpression groups (n = 6 per group) were examined by IHC staining for RALBP1
Fig. 8.
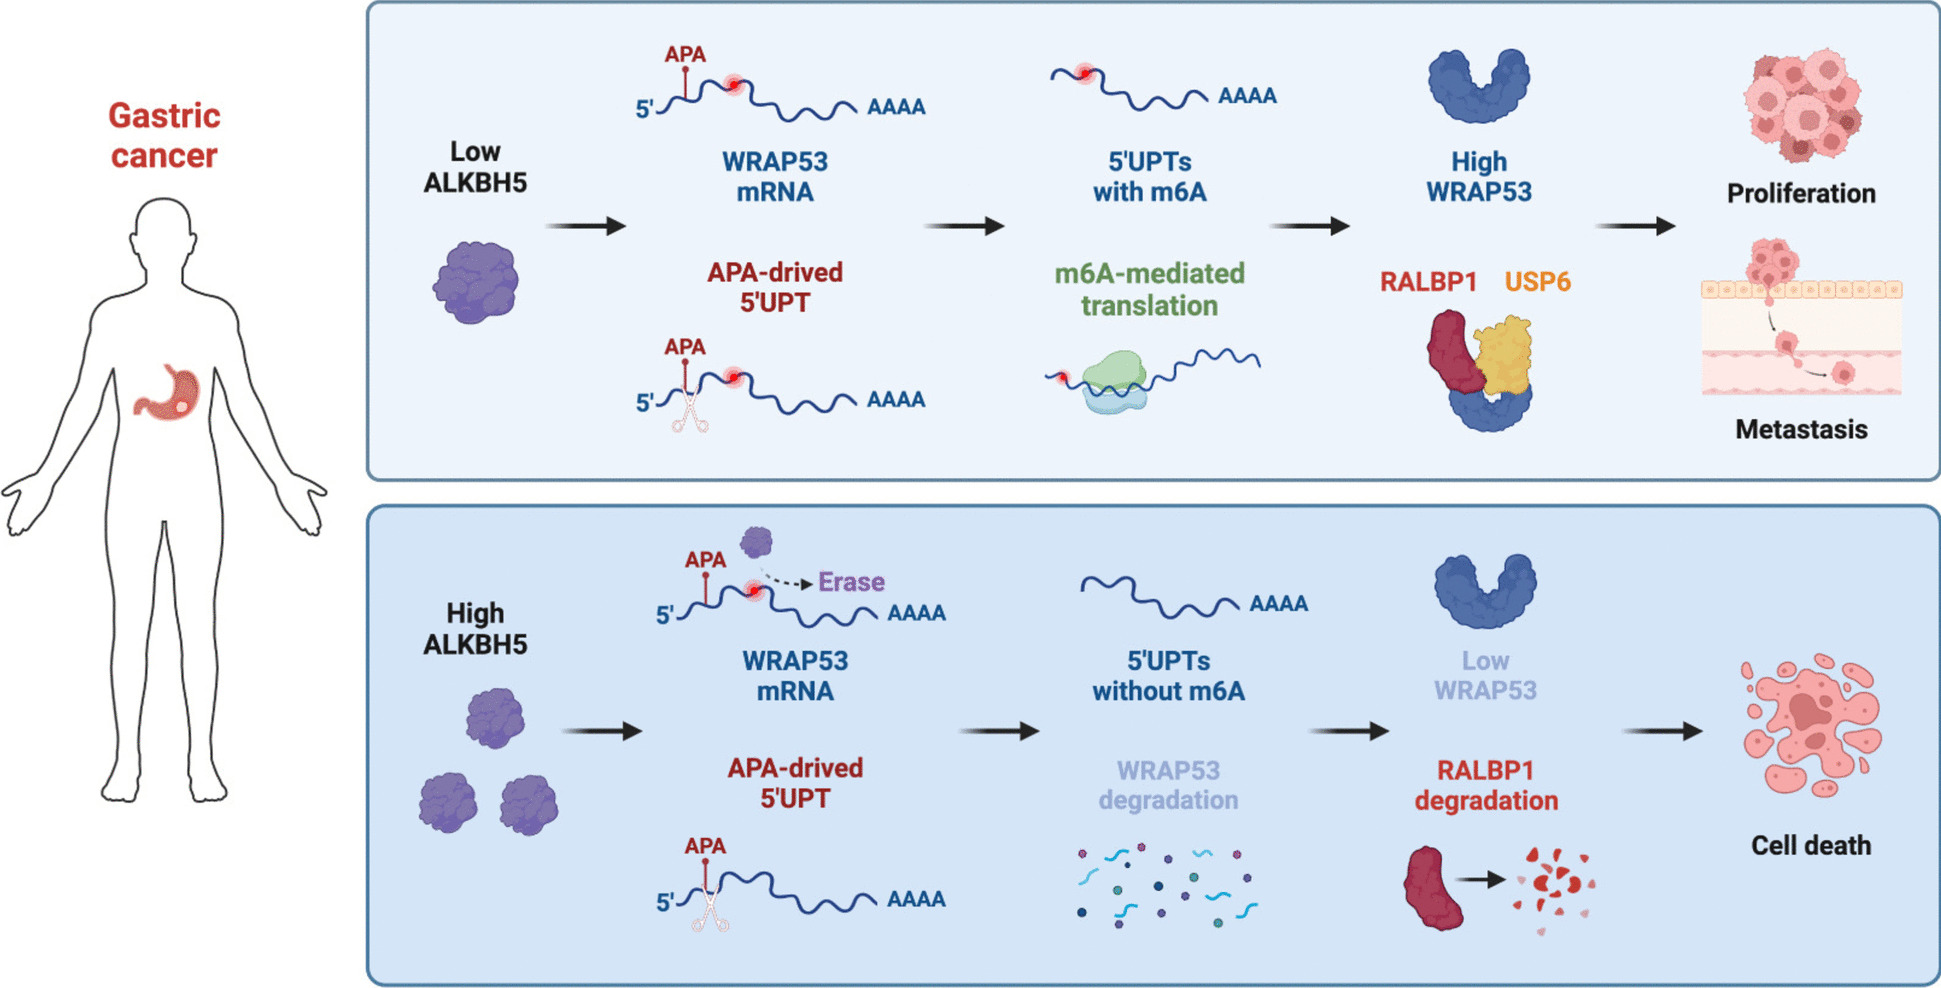
Schematic illustrating the proposed mechanism of ALKBH5's tumor-suppressive role in GC
Discussion
In the present study, we identified ALKBH5 as a marker of favorable prognosis in GC. As a key modulator in GC, ALKBH5 reduces WRAP53 expression by erasing m6A modifications on its 5’ UPT mRNA isoform, thereby inhibiting its translation. WRAP53 exerts a pro-cancer effect in GC, by acting as a scaffold that facilitates the physical interaction between USP6 and RALBP1 proteins, resulting in RALBP1 deubiquitylation and upregulation. Consequently, this activates the PI3K/Akt/mTOR signaling pathway, enhancing the proliferative and metastatic capabilities of GC cells.
Epigenetic mechanisms endow cells with the capacity to finely modulate gene expression in response to developmental and environmental changes, without altering the fundamental DNA sequence [32]. Among RNA modifications, m6A stands out as the most prevalent modification in eukaryotic mRNA and is intricately involved in nearly every facet of RNA metabolism, including maturation, transcription, translation, degradation, and stability [33]. Accumulating evidence underscores that m6A dysregulation can lead to the aberrant activation or suppression of genes critical to cell death, metabolism, and cell cycle, thereby profoundly affecting tumorigenesis and cancer progression in various cancer types, including gastric cancer [34–38]. Despite growing recognition of m6A as a pivotal regulator and checkpoint in various cancers, its specific roles and the underlying mechanisms in GC remain inadequately explored.
The controversial role of the major m6A demethylaseALKBH5 has been shown to be both oncogenic and tumor-suppressive in GC [39–43]. These seemingly contradictory roles of ALKBH5 may arise from its inherent functional diversity. As demonstrated in our RNA-seq results, while ALKBH5 knockdown activated multiple oncogenes, it also upregulated tumor suppressor genes, indicating that ALKBH5 may exert both oncogenic and tumor-suppressive effects depending on the genetic or environmental context, a hypothesis that provides an intriguing avenue for future investigation. It is plausible that this duality is influenced by a complex regulatory network, encompassing factors such as upstream and downstream modulators, tumor heterogeneity, individual genetic differences, the tumor microenvironment, or temporal and stage-specific factors. These considerations highlight the potential for ALKBH5 to play varying roles under different conditions, even within the same type of cancer.
Moreover, our findings elucidate the critical regulatory role of the combined effect of APA and m6A in cancer progression. APA is a well-studied post-transcriptional process that regulates the usage of polyadenylation sites (PASs) and is primarily recognized for producing diverse shorter upstream mRNA isoforms with distinct protein functions [44]. However, the discovery of 5’UPT isoforms downstream of APA sites reveals that APA’s influence on the transcriptome is more extensive than previously thought. Indeed, regulated by m6A, 5’UPTs can produce non-canonical proteins, which significantly expands the transcriptomic and proteomic landscape [24]. Our study found that the 5’UTR of WRAP53 contains an APA site with m6A modifications enriched downstream. Cleavage at this APA site in the canonical WRAP53 transcript generates downstream 5’UPTs. ALKBH5-mediated demethylation of the 5’UTR reduces the expression of these 5’UPTs, leading to the inhibition of downstream pathways and suppression of GC. These findings enhance our understanding of the role of ALKBH5 in regulating cap-independent translation. Additionally, the largely unelucidated impact of m6A modifications at the 5’ end of mRNA on translation is highlighted by our findings, which demonstrate that ALKBH5-mediated regulation at this site is crucial in the development and progression of GC.
Limitations also exist in the present study. The usage of ALKBH5 as a therapeutic target has not yet been validated in clinical applications. Moreover, the expression levels of ALKBH5 exhibit considerable variability among patients, as evidenced by our immunohistochemistry results. This variability raises questions about the generalizability of ALKBH5 as a molecular biomarker. Further investigation is needed to address this issue in future studies.
Conclusion
Conclusively, our results support the regulatory axis of ALKBH5/WRAP53/RALBP1, where ALKBH5 inhibits the non-canonical translation of WRAP53 through an m6A-dependent mechanism. This inhibition prevents the formation of the RALBP1-USP6 complex, leading to increased degradation of RALBP1 and reduced activation of the downstream PI3K/Akt/mTOR pathway. This study emphasizes the significant role of ALKBH5-mediated m6A demethylation in the progression and metastasis of GC and positions ALKBH5 as both a prognostic biomarker for gastric cancer.
Materials and methods
Patients and clinical specimens
This study was approved by the Institutional Ethical Review Board of the Sun Yat-sen University Cancer Center (B2024-765-01), and written informed consent was obtained from all patients. All freshly frozen GC tissues were collected from Sun Yat-sen University Cancer Center. All GC patients were confirmed histologically by two independent pathologists. All patients had well-documented clinical records and follow-up information.
Cell culture and conditions
The human gastric cell lines including AGS, MKN45, SNU-216, MKN28, SGC7901, HGC27, MKN74, as well as the immortalized epithelial cell line GES-1, were sourced from the American Type Culture Collection (ATCC). These cell lines were cultured in RPMI-1640 medium (Gibco, USA) with 10% fetal bovine serum (FBS, Gibco) and maintained at 37 °C in a humidified incubator with 5% CO2 to ensure optimal growth.
Animal experiments
The subcutaneous xenograft and metastasis models in BALB/c nude mice were established and analyzed as previously described [16]. All the experimental animal procedures were approved by the Institutional Animal Care and Use Ethics Committee of Sun Yat-sen University Cancer Center (L102022024080C). HGC27 cells were transduced with either a control lentivirus or a lentivirus overexpressing ALKBH5. Nude mice were randomly assigned to groups and anesthetized for treatment. In the in vivo tumorigenesis model, 1 × 10⁶ HGC27 cells were subcutaneously injected into the flanks of the mice, and tumor volumes were measured every 4 days. On day 32, the mice were sacrificed, and tumors were excised, weighed, measured, and analyzed for ALKBH5 expression using qPCR and immunohistochemistry (IHC). For the lung metastasis model, 5 × 10⁶ HGC27 cells were injected into the tail vein. After 2 months, the mice were euthanized, and the lungs were collected for hematoxylin–eosin (H&E) staining. In the inguinal lymph node metastasis model, 2 × 10⁵ HGC27 cells were injected into the footpads. After 6 weeks, mice were sacrificed, and both footpad tumors and inguinal lymph nodes were harvested, paraffin-embedded, and sectioned into 5 μm slices. Footpad tumors underwent H&E staining, and the inguinal lymph nodes were measured and stained with Pan-CK. All procedures adhered to laboratory animal management guidelines.
Quantitative real-time PCR (qPCR)
Total RNA was extracted from clinical tissues or cell lines using TRIzol reagent (Invitrogen, USA). The HiScriptIII One-Step Strand cDNA Synthesis Kits (Vazyme, China) was utilized for cDNA synthesis from the isolated RNA. qPCR was performed with SYBR Green Master Mix (Invitrogen), and the threshold cycle number (CQ) was measured in triplicate for each sample. GAPDH (glyceraldehyde-3-phosphate dehydrogenase) was used as an internal control for CQ normalization, and relative expression levels were calculated using the Comparative Ct method (ΔΔCt method). The qPCR primer sequences are listed in Supplementary Table S2.
Plasmid construction, cell transfection, and lentiviral infection
For gene knockdown, duplex RNA interference (RNAi) oligonucleotides targeting specific genes were designed and synthesized by GenePharma (Shanghai, China), with a scrambled RNA oligonucleotide used as a negative control. The scrambled has the same nucleotide composition as the selected siRNA but no significant homology to any known mRNA. For gene overexpression, cDNAs encoding the full open reading frames of human ALKBH5, WRAP53, USP6, and RALBP1 were sourced from OBiO Technology (Shanghai, China) and Umine Biotechnology (Guangzhou, China). Specifically, RALBP1 and USP6 were engineered to include an N-terminal HA-tag. Additionally, full-length, truncated, and m6A site-mutated variants (wild type, A-T, A-G, A-Del) of WRAP53 were engineered by GenScript (Nanjing, China) and cloned into pcDNA3.1 (-) or pmirGLO vectors for overexpression or dual-luciferase studies, respectively, with an empty vector serving as the control. Cells were transfected with siRNAs using Lipofectamine RNAiMAX (Invitrogen) and with plasmids employing Lipofectamine 3000 (Invitrogen), in alignment with the guidelines provided by the manufacturers. The sequences of siRNAs are detailed in Supplementary Table S3. For stable knockout of ALKBH5, the gRNAs were designed and synthesized by RiboBio (Guangzhou, China), and riboEDIT™ CRISPR-Cas9 system (RiboBio) was used for ALKBH5 knocking out accordingly to the instruction manual. For stable overexpression of ALKBH5, its coding sequence was cloned into a lentiviral vector and co-transfected with packaging plasmids pMD2.G and psPAX2 (Addgene) into HEK 293T cells using the calcium phosphate method. After 48 h, the supernatant containing viral particles was collected and filtered through a 0.45 μm filter. HGC27 cells were infected with the resultant lentivirus at a specified multiplicity of infection. Stable overexpressing cell lines were established by selecting with 1 µg/ml puromycin (Thermo Fisher Scientific, USA) for seven days, followed by expansion and maintenance under puromycin to ensure sustained ALKBH5 expression.
Western blotting
Cells were lysed using PIPA lysis buffer (Millipore, USA) with added protease and phosphatase inhibitors (Thermo Fisher Scientific, USA) to extract total protein. Protein concentration was quantified with the BCA Protein Assay Kit (Thermo Fisher Scientific). Western blotting was conducted following the protocol described in our previous study [45]. The antibodies used included anti-ALKBH5 (1:1000; Abcam, USA), anti-WRAP53 (1:1000; ProteinTech, China), anti-CCDC88C (1:1000; ProteinTech), anti-NDUFB2 (1:1000; Abcam; ), anti-HA-tag (1:5000, Abcam), anti-USP6 (1:2500; Abcam), anti-PI3K (1:1000; CST, USA), anti- phosphor-PI3K (1:1000; CST), anti-total Akt (1:1000; CST), anti-phospho-Akt (Ser-473; 1:1000; CST), anti-phospho-Akt (Ser-308; 1:1000; CST), anti-mTOR (1:1000; CST, USA), anti-phospho-mTOR (1:1000; CST, USA), and anti-α-tubulin (1:5000, Abcam).
Immunohistochemistry (IHC)
Paraffin-embedded tissue samples were cut into 5 mm sections, deparaffinized, rehydrated, treated to inactivate endogenous peroxidase activity, and subjected to antigen retrieval before being blocked with goat serum. The sections were then incubated overnight at 4 °C with anti-ALKBH5 antibodies (1:200, Abcam) or anti-pan-cytokeratin antibodies (ZSGB-Bio, Beijing, China), followed by treatment with appropriate secondary antibodies. IHC staining analysis utilized the immunoreactivity scoring (IRS) system, as previously described [46]. Staining intensity was categorized as nonexistent (0), weak (1), moderate (2), or strong (3), and the proportion of stained cells was scored as no staining (0), less than 25% stained (1), 25–50% stained (2), 51–75% stained (3), or more than 75% stained (4). The IRS was calculated by multiplying these two scores. For statistical analysis, cases were classified as either ALKBH5 low (IRS 0–6) or ALKBH5 high (IRS 7–12) based on their expression levels.
Cell proliferation and colony formation assays
To assess cell proliferation, 2000 cells were plated in each well of a 96-well plate, and viability was measured daily for 5 days using the Cell Counting Kit-8 (CCK-8, Dojindo, Japan). For the colony formation assay, 600 cells were seeded per well in 6-well plates and cultured for 10 to 14 days until colonies became visible. These colonies were then washed, fixed with methanol, stained with hematoxylin, and counted for further analysis.
Transwell migration and invasion assay
Transwell assays were performed to assess cell migration and invasion. For the migration assay, 5 × 10⁴ cells in serum-free medium were seeded into the upper chamber of a Transwell insert. For the invasion assay, 1 × 10⁵ cells were seeded into the upper chamber pre-coated with Matrigel (BD Biosciences, USA) in serum-free medium. The lower chamber was filled with medium containing 10% fetal bovine serum (FBS) to act as a chemoattractant. After 24 h of incubation, cells that had migrated or invaded to the lower surface of the membrane were fixed, stained with hematoxylin, and counted under an inverted microscope.
RNA sequencing (RNA-seq), data acquisition, and functional enrichment analysis
Total RNA was extracted from AGS cells transfected with siRNAs targeting ALKBH5, followed by RNA-seq conducted using the Illumina Novaseq 6000 platform (Illumina, USA). Bulk RNA-seq data were obtained from The Cancer Genome Atlas (TCGA), and microarray data (GSE236522) were sourced from the Gene Expression Omnibus (GEO) database. To explore the functional implications of the differentially expressed genes, enrichment analyses were performed using the “clusterProfiler” and “org.Hs.eg.db” R packages. Key pathways were identified within the Kyoto Encyclopedia of Genes and Genomes (KEGG) and Gene Ontology (GO) databases. We also conducted gene set enrichment analysis (GSEA) to identify biological functions associated with lower ALKBH5 expression in GC. Significant pathways were determined using a threshold of P < 0.05 and a false discovery rate (FDR) ≤ 0.25.
m6A RNA immunoprecipitation (MeRIP)
Total RNA was extracted from AGS cells that were either transfected with scrambled siRNA or siRNA targeting ALKBH5, and HGC2 cells transfected with empty vector or ALKBH5-overesspressing vectors. Following RNA purification and fragmentation, the samples were subjected to immunoprecipitation using a Magna MeRIP m6A kit (Millipore) according to the manufacturer’s protocol. Briefly, the RNA samples were incubated overnight at 4 °C with an anti-m6A antibody (Synaptic Systems) in immunoprecipitation buffer (150 mM NaCl, 10 mM Tris-HCl, pH 7.4, 0.1% NP-40) containing protease and RNase inhibitors, along with protein A/G magnetic beads (Thermo Scientific, USA). The m6A-modified RNA was then eluted followed by purification through Phenol/Chloroform/Isoamyl alcohol (25:24:1, Millipore) extraction. The enriched m6A-modified RNA was subsequently analyzed by qPCR or RNA-seq.
Ribosome profiling sequencing (Ribo-seq)
Ribo-seq was performed as previously described [47]. Briefly, cells were treated with cycloheximide (100 µg/ml) for 8 to 10 min to inhibit translation, followed by washing with ice-cold phosphate-buffered saline, pelleting, and lysis in a polysome buffer containing Tris-HCl, KCl, MgCl2, Triton X-100, DTT, and protease inhibitors. The lysates were centrifuged, and the supernatant was treated with RNase I (Invitrogen). After fractionation on a sucrose gradient, monosome-enriched fractions were collected, and RNA fragments were released using proteinase K. These RNA fragments were then purified and size-selected for ribosome-protected fragments (30–33 nucleotides) before being converted into cDNA libraries for RNA-seq.
Dual-luciferase reporter assay
Dual-luciferase reporter assay was conducted to assess cellular gene expression. GC cells were co-transfected with Firefly and Renilla luciferase reporter constructs (Promega, USA). 48 h following transfection, the activities of both luciferases were quantified using the Dual-luciferase Reporter Assay System (Promega), following the manufacturer’s protocol. Normalization of Firefly luciferase activity to Renilla luciferase activity ensured an accurate control for transfection efficiency.
Immunofluorescence (IF)
IF staining was performed to examine the co-localization and interaction of RALBP1 with WRAP53 or USP6. After culturing cells on glass slides for 24 h and completing the fixation and permeabilization steps, they were first incubated with anti-RALBP1 antibodies at a dilution of 1:100 (Abcam), followed by incubation with either anti-WRAP53 or anti-USP6 antibodies, each also at a 1:100 dilution (Abcam). Nuclei were subsequently stained with 4′,6-diamidino-2-phenylindole (DAPI, Sigma). An Olympus FV1000 confocal microscope (Olympus, Japan) was used for fluorescence images capture.
Immunoprecipitation (IP)
IP assay was conducted using the Pierce™ Co-Immunoprecipitation Kit (Thermo Fisher) in accordance with the manufacturer’s guidelines. Cells were lysed in IP buffer containing a Protease/Phosphatase Inhibitor Cocktail. The lysates were precleared and then incubated overnight at 4 °C with gentle rotation using anti-WRAP63, anti-RALBP1, or anti-hemagglutinin (HA) antibodies (Abcam). Normal IgG antibodies served as controls. The resulting immunocomplexes were collected, washed three times with IP buffer, and subsequently processed for analysis by Western blotting or mass spectrometry (Fitgene Biotech).
Statistical analyses
Experiments were conducted in triplicate or more for reliability. Statistical analysis was performed using GraphPad Prism 8.0 (GraphPad Inc, USA), SPSS 23.0 (IBM, USA), and R (version 4.1). Results are presented as mean ± standard deviation (SD). Differences between two groups were analyzed using the Student’s t-test or chi-square test. One-way ANOVA followed by Bonferroni’s test was used for multiple group comparisons. Survival curves were generated with the Kaplan–Meier method and evaluated using the Log-rank test. Cox regression analysis, both univariate and multivariate, was used to determine hazard ratios and 95% confidence intervals. A P-value of less than 0.05 was considered statistically significant.
Supplementary Information
Supplementary Material 1: Figure S1. Lower ALKBH5 expression was associated with gastric cancer tumorigenesis. Figure S2. Inhibition of ALKBH5 expression promotes the proliferation, migration and invasion of gastric cancer cells. Figure S3. Quantification of m6A levels in subcutaneous tumors and footpad tumors in nude mice. Figure S4. MeRIP-seq in AGS cells with or without ALKBH5 silenced. Figure S5. Z-Stack of HGC27 cells reflecting the co-localization of RALBP1 and USP6. Figure S6. Verification of siRNA USP6 and WRAP53 knockdown efficiency.
Authors’ contributions
Conceptualization, Z.Q.Z., F.Z.L., Y.M.C.; Data production, analysis and investigation, Z.Q.Z., F.Z.L., B.W.Z., G.M.C., C.Z.W., X.J.C., R.C.N., R.P.Z., Z.K.Z.,; Writing, Review and Edit, Z.Q.Z., F.Z.L., Y.M.C., Y.F.L., W.G.D., L.Y.J.; Supervision, Y.M.C., Y.F.L., W.G.D., L.Y.J.; Funding acquisition, Z.Q.Z.,R.C.N. The author(s) read and approved the final manuscript.
Funding
This work was supported by grants from the National Natural Science Foundation of China (No.82303803, 82103586), the China Postdoctoral Science Foundation (No. 2022TQ0390, 2022M723655).
Data availability
No datasets were generated or analysed during the current study. The datasets generated and/or analyzed during this study are available at Research Data Deposit public platform (www.researchdata.org.cn) (RDDB2024491272).
Declarations
Ethics approval and consent to participate
This study was approved by the Institutional Review Board of Sun Yat-Sen University Cancer Center. All animal experiments were approved by the Institutional Animal Care and Use Committee, Sun Yat-sen University Cancer Center (L102022024080C).
Competing interests
The authors declare no competing interests.
Footnotes
Publisher’s note
Springer Nature remains neutral with regard to jurisdictional claims in published maps and institutional affiliations.
Ziqi Zheng, Feizhi Lin, Baiwei Zhao and Guoming Chen contributed equally to this work.
Contributor Information
Yuanfang Li, Email: liyuanf@sysucc.org.cn.
Weigang Dai, Email: daiweig@mail.sysu.edu.cn.
Yijia Lin, Email: linyj3@mail.sysu.edu.cn.
Yongming Chen, Email: chenyongm@sysucc.org.cn.
References
- 1.Bray F, et al. Global cancer statistics 2022: GLOBOCAN estimates of incidence and mortality worldwide for 36 cancers in 185 countries. CA Cancer J Clin. 2024;74(3):229–63. [DOI] [PubMed] [Google Scholar]
- 2.Guan WL, He Y, Xu RH. Gastric cancer treatment: recent progress and future perspectives. J Hematol Oncol. 2023;16(1):57. [DOI] [PMC free article] [PubMed] [Google Scholar]
- 3.Lin F, et al. Application of immune checkpoint inhibitors for resectable gastric/gastroesophageal cancer. Front Pharmacol. 2024;15:1391562. [DOI] [PMC free article] [PubMed] [Google Scholar]
- 4.Li G, et al. Critical roles and clinical perspectives of RNA methylation in cancer. MedComm (2020). 2024;5(5):e559. [DOI] [PMC free article] [PubMed] [Google Scholar]
- 5.Wilkinson AL, Zorzan I, Rugg-Gunn PJ. Epigenetic regulation of early human embryo development. Cell Stem Cell. 2023;30(12):1569–84. [DOI] [PubMed] [Google Scholar]
- 6.Hogg SJ, et al. Targeting the epigenetic regulation of antitumour immunity. Nat Rev Drug Discov. 2020;19(11):776–800. [DOI] [PubMed] [Google Scholar]
- 7.Chen Y, et al. Epigenetic modification of nucleic acids: from basic studies to medical applications. Chem Soc Rev. 2017;46(10):2844–72. [DOI] [PubMed] [Google Scholar]
- 8.Liu Y, et al. N6-methyladenosine-mediated gene regulation and therapeutic implications. Trends Mol Med. 2023;29(6):454–67. [DOI] [PubMed] [Google Scholar]
- 9.Wang Y, et al. Epigenetic modification of m(6)a regulator proteins in cancer. Mol Cancer. 2023;22(1):102. [DOI] [PMC free article] [PubMed] [Google Scholar]
- 10.Jonkhout N, et al. The RNA modification landscape in human disease. RNA. 2017;23(12):1754–69. [DOI] [PMC free article] [PubMed] [Google Scholar]
- 11.He L, et al. Functions of N6-methyladenosine and its role in cancer. Mol Cancer. 2019;18(1):176. [DOI] [PMC free article] [PubMed] [Google Scholar]
- 12.Hinnebusch AG, Ivanov IP, Sonenberg N. Translational control by 5’-untranslated regions of eukaryotic mRNAs. Science. 2016;352(6292):1413–6. [DOI] [PMC free article] [PubMed] [Google Scholar]
- 13.Boulias K, Greer EL. Biological roles of adenine methylation in RNA. Nat Rev Genet. 2023;24(3):143–60. [DOI] [PMC free article] [PubMed] [Google Scholar]
- 14.Malka Y, et al. Alternative cleavage and polyadenylation generates downstream uncapped RNA isoforms with translation potential. Mol Cell. 2022;82(20):3840-e38558. [DOI] [PMC free article] [PubMed] [Google Scholar]
- 15.Zou Y, et al. N6-methyladenosine regulated FGFR4 attenuates ferroptotic cell death in recalcitrant HER2-positive breast cancer. Nat Commun. 2022;13(1):2672. [DOI] [PMC free article] [PubMed] [Google Scholar]
- 16.Zheng ZQ, et al. VIRMA promotes nasopharyngeal carcinoma, tumorigenesis, and metastasis by upregulation of E2F7 in an m6A-dependent manner. J Biol Chem. 2023;299(5):104677. [DOI] [PMC free article] [PubMed] [Google Scholar]
- 17.Ge L, et al. The RNA m(6)a reader IGF2BP3 regulates NFAT1/IRF1 axis-mediated anti-tumor activity in gastric cancer. Cell Death Dis. 2024;15(3):192. [DOI] [PMC free article] [PubMed] [Google Scholar]
- 18.Zhong F, et al. Disruption of telomerase trafficking by TCAB1 mutation causes dyskeratosis congenita. Genes Dev. 2011;25(1):11–6. [DOI] [PMC free article] [PubMed] [Google Scholar]
- 19.Rao X, et al. Overexpression of WRAP53 is associated with development and progression of esophageal squamous cell carcinoma. PLoS One. 2014;9(3): e91670. [DOI] [PMC free article] [PubMed] [Google Scholar]
- 20.Yuan XS, et al. Clinical, cellular, and bioinformatic analyses reveal involvement of WRAP53 overexpression in carcinogenesis of lung adenocarcinoma. Tumour Biol. 2017;39(3):1010428317694309. [DOI] [PubMed] [Google Scholar]
- 21.Liu T, et al. Genome-wide investigation of lncRNAs revealed their tight association with gastric cancer. J Cancer Res Clin Oncol. 2024;150(5):261. [DOI] [PMC free article] [PubMed] [Google Scholar]
- 22.Qu J, et al. RNA demethylase ALKBH5 in cancer: from mechanisms to therapeutic potential. J Hematol Oncol. 2022;15(1):8. [DOI] [PMC free article] [PubMed] [Google Scholar]
- 23.Lan Q, et al. The critical role of RNA m(6)a methylation in cancer. Cancer Res. 2019;79(7):1285–92. [DOI] [PubMed] [Google Scholar]
- 24.Malka, Y., et al., Alternative cleavage and polyadenylation generates downstream uncapped RNA isoforms with translation potential. Mol Cell. 2022;82(20):3840-3855.e8. [DOI] [PMC free article] [PubMed]
- 25.Awasthi S, et al. RLIP76 and cancer. Clin Cancer Res. 2008;14(14):4372–7. [DOI] [PMC free article] [PubMed] [Google Scholar]
- 26.Singhal SS, et al. Activating p53 function by targeting RLIP. Biochim Biophys Acta Rev Cancer. 2021;1875(2):188512. [DOI] [PMC free article] [PubMed] [Google Scholar]
- 27.Swatek KN, Komander D. Ubiquitin modifications. Cell Res. 2016;26(4):399–422. [DOI] [PMC free article] [PubMed] [Google Scholar]
- 28.Madan B, et al. USP6 oncogene promotes Wnt signaling by deubiquitylating Frizzleds. Proc Natl Acad Sci U S A. 2016;113(21):E2945-2954. [DOI] [PMC free article] [PubMed] [Google Scholar]
- 29.Quick L, et al. Jak1-STAT3 signals are essential effectors of the USP6/TRE17 oncogene in tumorigenesis. Cancer Res. 2016;76(18):5337–47. [DOI] [PMC free article] [PubMed] [Google Scholar]
- 30.Alzahrani AS. PI3K/Akt/mTOR inhibitors in cancer: at the bench and bedside. Semin Cancer Biol. 2019;59:125–32. [DOI] [PubMed] [Google Scholar]
- 31.Fattahi S, et al. PI3K/AKT/mTOR signaling in gastric cancer: epigenetics and beyond. Life Sci. 2020;262:118513. [DOI] [PubMed] [Google Scholar]
- 32.Dawson MA, Kouzarides T. Cancer epigenetics: from mechanism to therapy. Cell. 2012;150(1):12–27. [DOI] [PubMed] [Google Scholar]
- 33.Zhao BS, Roundtree IA, He C. Post-transcriptional gene regulation by mRNA modifications. Nat Rev Mol Cell Biol. 2017;18(1):31–42. [DOI] [PMC free article] [PubMed] [Google Scholar]
- 34.Ou X, et al. Methylation of GPRC5A promotes liver metastasis and docetaxel resistance through activating mTOR signaling pathway in triple negative breast cancer. Drug Resist Updat. 2024;73:101063. [DOI] [PubMed] [Google Scholar]
- 35.Zhang C, et al. POP1 facilitates proliferation in triple-negative breast cancer via m6A-Dependent degradation of CDKN1A mRNA. Resea (Wash D C). 2024;7:0472. [DOI] [PMC free article] [PubMed] [Google Scholar]
- 36.Yang H, et al. Hypoxia inducible lncRNA-CBSLR modulates ferroptosis through m6A-YTHDF2-dependent modulation of CBS in gastric cancer. J Adv Res. 2022;37:91–106. [DOI] [PMC free article] [PubMed] [Google Scholar]
- 37.Xu W, et al. m6A RNA methylation-mediated NDUFA4 promotes cell proliferation and metabolism in gastric cancer. Cell Death Dis. 2022;13(8):715. [DOI] [PMC free article] [PubMed] [Google Scholar]
- 38.Jing JJ, et al. Expression profiles and prognostic roles of m6A writers, erasers and readers in gastric cancer. Future Oncol. 2021;17(20):2605–20. [DOI] [PubMed] [Google Scholar]
- 39.Zhang Z, et al. N6-methyladenosine demethylase ALKBH5 suppresses colorectal cancer progression potentially by decreasing PHF20 mRNA methylation. Clin Transl Med. 2022;12(8):e940. [DOI] [PMC free article] [PubMed] [Google Scholar]
- 40.Chen C, et al. ALKBH5-mediated CHAC1 depletion promotes malignant progression and decreases cisplatin-induced oxidative stress in gastric cancer. Cancer Cell Int. 2023;23(1):293. [DOI] [PMC free article] [PubMed] [Google Scholar]
- 41.Shen D, et al. RNA demethylase ALKBH5 promotes colorectal cancer progression by posttranscriptional activation of RAB5A in an m6A-YTHDF2-dependent manner. Clin Transl Med. 2023;13(5):e1279. [DOI] [PMC free article] [PubMed] [Google Scholar]
- 42.Fang Y, et al. LINC00659 cooperated with ALKBH5 to accelerate gastric cancer progression by stabilising JAK1 mRNA in an m(6) A-YTHDF2-dependent manner. Clin Transl Med. 2023;13(3):e1205. [DOI] [PMC free article] [PubMed] [Google Scholar]
- 43.Hu Y, et al. Demethylase ALKBH5 suppresses invasion of gastric cancer via PKMYT1 m6A modification. Mol Cancer. 2022;21(1):34. [DOI] [PMC free article] [PubMed] [Google Scholar]
- 44.Gruber, A.J. and M. Zavolan, Alternative cleavage and polyadenylation in health and disease. Nat Rev Genet. 2019;20(10):599-614. [DOI] [PubMed]
- 45.Zheng ZQ, et al. Hyperactivation of mTOR/eIF4E signaling pathway promotes the production of tryptophan-to-phenylalanine substitutants in EBV-positive gastric cancer. Adv Sci (Weinh). 2024;11(35):e2402284. [DOI] [PMC free article] [PubMed]
- 46.Weichert W, et al. Polo-like kinase isoform expression is a prognostic factor in ovarian carcinoma. Br J Cancer. 2004;90(4):815–21. [DOI] [PMC free article] [PubMed] [Google Scholar]
- 47.Loayza-Puch F, et al. 53 induces transcriptional and translational programs to suppress cell proliferation and growth. Genome Biol. 2013;14(4):R32. [DOI] [PMC free article] [PubMed] [Google Scholar]
Associated Data
This section collects any data citations, data availability statements, or supplementary materials included in this article.
Supplementary Materials
Supplementary Material 1: Figure S1. Lower ALKBH5 expression was associated with gastric cancer tumorigenesis. Figure S2. Inhibition of ALKBH5 expression promotes the proliferation, migration and invasion of gastric cancer cells. Figure S3. Quantification of m6A levels in subcutaneous tumors and footpad tumors in nude mice. Figure S4. MeRIP-seq in AGS cells with or without ALKBH5 silenced. Figure S5. Z-Stack of HGC27 cells reflecting the co-localization of RALBP1 and USP6. Figure S6. Verification of siRNA USP6 and WRAP53 knockdown efficiency.
Data Availability Statement
No datasets were generated or analysed during the current study. The datasets generated and/or analyzed during this study are available at Research Data Deposit public platform (www.researchdata.org.cn) (RDDB2024491272).