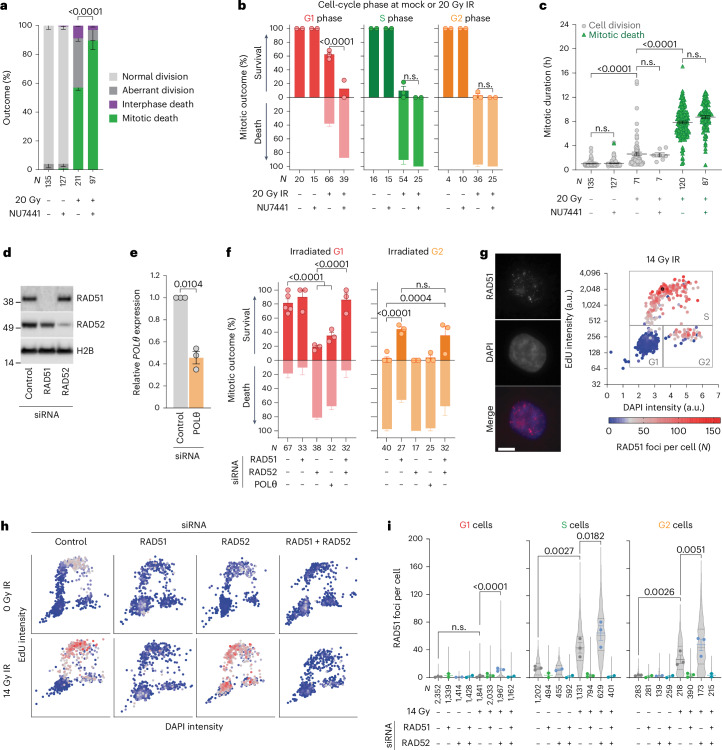
Fig. 2. DSB repair pathways guide cell death mode following IR.
a–c, All cell cycle outcomes over 120 h (a), first mitosis outcomes (b) and all mitotic durations (c) for 3F HeLa ± 0.5 µM NU7441. The 20 Gy IR are from Fig. 1, and the irradiated samples in c are stratified by outcome (for a and b, the mean ± s.e.m. n = 2, except 20 Gy (n = 3), two-sided Fisher’s exact test of N; for c, mean ± s.e.m. and Kruskal–Wallis uncorrected Dunn’s multiple comparisons test of N). d, Western blots of whole-cell extracts from 3F HeLa (representative of n = 3). e, Quantitative PCR with reverse transcription of 3F HeLa (mean ± s.e.m., n = 3, two-tailed paired t-test, t = 9.7, d.f. of 2, 95% confidence interval (CI) −0.79 to −0.30; fold change relative to control siRNA, normalized to 1). f, The first mitosis outcome in 3F HeLa (mean ± s.e.m., n = 3, except control siRNA (n = 5); two-sided Fisher’s exact test of N). g, Example images and RAD51 foci quantitation from HeLa. Each dot represents a single cell (representative of n = 3). Scale bar, 20 µm. h,i, RAD51 foci in siRNA transfected HeLa ± 14 Gy IR (h) and quantitation (i) (for i, mean ± s.e.m. n = 3, 2, 2, 2, 3, 3, 3 and 2 from left to right; violin plots of N; the dotted lines are quartiles and the solid lines medians; ordinary one-way ANOVA with Fisher’s Least Significant Difference (LSD) multiple comparisons test). For a–i, N = individual cells across all replicates and n = biological replicates. n.s., not significant.

