

Abstract
Typical waveforms used for the simulation of pressure and volume-controlled ventilation in medical ventilators have been extensively studied in the literature. The majority of simulation studies reported employ the step pattern or ramp pattern to model the pressure and flow variations in pressure/volume-controlled ventilation. It was observed that the above waveforms tend to add to the discomfort level of patients due to the presence of jerks in derivatives of pressure/flow variations; the pressure/flow variation of air and oxygen mixture should be smooth so that the patient discomfort is kept at a minimal level. To overcome the above-mentioned drawback, a careful study of the flow/pressure simulation using a cycloidal pattern during the inhalation and exhalation phases of the breath cycle was proposed and investigated in this work. Based on transient analysis of the pressure variation simulation, it was observed that the air and oxygen mixture delivered to the patient was relatively jerk-free due to the finite values of first and second-order derivatives of pressure/flow curves. Mathematical models of the proposed simulation study of the cycloidal pattern of flow variation in both pressure/volume-controlled ventilation, are formulated and presented for use by ventilator designers. A comparative study of the simulation of step, ramp and cycloidal profiles applied to the breath cycle in a typical pressure-controlled ventilation is carried out and a marginal decrease in tidal volumes was observed in the case of cycloidal profiles for a given set of ventilator settings and the results are discussed. A typical natural breath pattern of a healthy adult was experimentally measured using a CITRIX breath analyser and the above mathematical model for the volume-controlled ventilation was found to closely describe the natural breathing process, using statistical parameters. Thus, the proposed cycloidal profile of pressure/flow variations in medical ventilators will be a better alternative, when compared to the step/ramp profiles investigated in this work; further, the proposed cycloidal profile matches closely with the natural breath pattern, based on typical experimental studies.
Supplementary Information
The online version contains supplementary material available at 10.1038/s41598-025-86187-5.
Keywords: Ventilator waveforms, Step, Ramp, Cycloidal, PCV, VCV, Normal breathing, Mathematical modelling
Subject terms: Preclinical research, Biomedical engineering
Introduction
Mechanical ventilation (MV) is a vital, lifesaving technique used to support patients with respiratory insufficiencies or non-functioning lungs1. A ventilator is a medical device employed by healthcare professionals to automatically inflate the lungs of patients who are unable to breathe independently or require external breathing support. Lung inflation is achieved by precisely controlling either the volume or pressure of the delivered air and oxygen mixture. Additionally, the ventilator facilitates the mixing of air and oxygen to deliver a planned proportion of oxygen into the patient’s lungs2.
Among the various ventilator modes, Volume Control and Pressure Control Ventilation are the two most commonly used. Simulation studies are often employed to assess ventilator performance, as models of the respiratory system are easier to understand and experiment with than real expiratory systems. Amanda Dexter et al. validated paediatric lung models using the ASL 5000 breathing simulator, comparing the results with literature data through a t-test, and found only minimal inconsistencies. This confirmed the effectiveness of the ASL 5000 simulator3. Similarly, Robert L. Chatburn and Aude Garnero collected data from passively ventilated adult subjects and found that the results fell within the expected range for respiratory parameters such as Compliance, Resistance, Tidal Volume, and PEEP4. Their study highlights that the primary goal of mechanical ventilation is to restore gas exchange and alleviate patient discomfort. Minimizing discomfort in ventilation is essential to ensure that patients can breathe as naturally as possible, even while supported by a ventilator. The ventilator should not add to the burden of an already weak patient but rather support their normal breathing pattern without requiring painful adjustments. Proper synchronization of ventilator settings with the patient’s natural breathing rhythm can make ventilation feel seamless, allowing for a more comfortable and supportive experience during treatment.
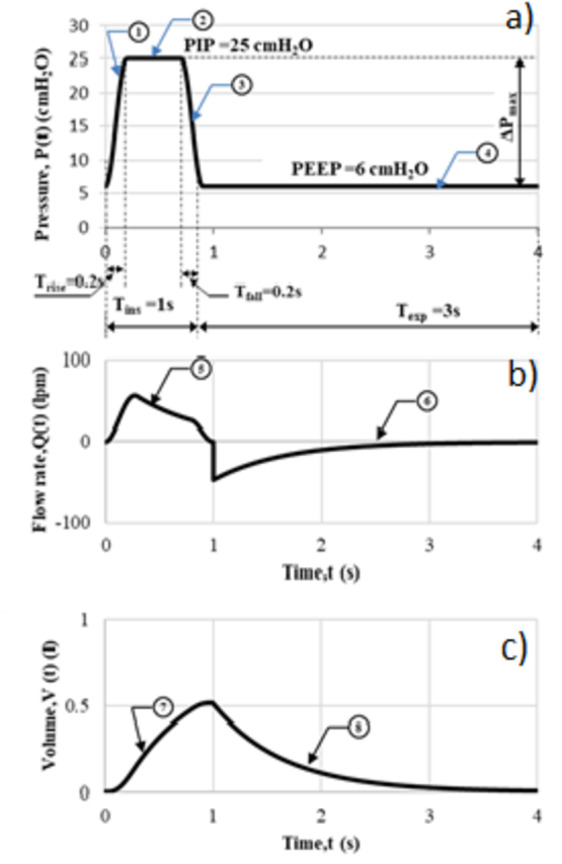
Figure 1. illustrates the key ventilation parameters with the help of a typical set of pressure, flow and volume waveforms which are generally used to characterize mechanical ventilation. The different ventilation parameters reported in the literature are summarized in Appendix I together with their definitions and the range of practical values for an adult4,5.
Fig. 1.

A typical Ventilator waveform – Nomenclature of key parameters of ventilation.
Pressure controlled ventilation (PCV) vs. volume controlled ventilation (VCV)
In Pressure-Controlled Ventilation (PCV), the ventilator is set to deliver air oxygen mixture at a specific pressure. The volume of air can vary depending on the patient’s needs, but the pressure remains constant. In Volume-Controlled Ventilation, the ventilator is set to deliver a specific amount of air oxygen mixture to the patient with each breath.
Pressure control ventilation delivers mechanical breaths at a set inspiratory pressure, allowing clinicians to regulate the distending pressure applied to the airways and alveoli. The volume delivered is variable and depends on the patient’s inspiratory effort. The goal of this ventilation is to achieve the appropriate alveolar pressure as defined by the clinician6,7. Pressure control ventilation allows the peak inspiratory pressure (PIP) to be limited to a safe level, reducing the risk of lung damage and minimizing barotrauma in patients. In contrast, volume control ventilation enables more precise control of tidal volume (Vt) delivery, ensuring the patient’s physiological needs are met and minimizing the risk of over-ventilation and associated volutrauma8,9.
Related literature
The literature emphasizes the critical importance of incorporating an adaptive demand flow system in medical ventilators. This system is essential for minimizing patient discomfort while ensuring precise airflow delivery, as it closely aligns with the patient’s natural breathing patterns.
Roubík, Karel, et al. focused on developing and controlling a demand flow system that enables spontaneous breathing for patients connected to a High Frequency Oscillation (HFO) ventilator. Their study discusses the control strategy used in the demand flow system to regulate gas flow and pressure according to the patient’s breathing patterns. This approach aims to provide appropriate ventilation support while aligning with the patient’s natural respiratory rhythm1. Mike Borrello et al. explored the implementation of adaptive control techniques for a proportional flow valve used in critical care ventilators, emphasizing the importance of delivering precise and adjustable gas flow rates to meet the respiratory needs of patients2. Amanda Dexter et al. demonstrated the effective validation of lung models using the ASL 5000 breathing simulator, ensuring the accuracy and reliability of simulated respiratory parameters, ultimately enhancing the quality and applicability of lung models in various healthcare applications3.
Chatburn, in his book4, provides a comprehensive overview of mechanical ventilation principles and their practical applications. It details regarding the ventilator settings and parameters, including tidal volume, respiratory rate, inspiratory flow rate, inspiratory time, positive end-expiratory pressure (PEEP), and FiO2 (Fraction of Inspired Oxygen). Strategies and interventions aimed at reducing the Work of Breathing (WoB) are discussed by Cabello in his work5. It emphasizes the importance of understanding WOB in assessing respiratory effort and monitoring respiratory function in critically ill patients. In their work10, the authors focus on the simulation and analysis of a mathematical model related to Pressure Controlled Ventilation (PCV). Ashworth, in his research work11, discusses considerations for weaning patients from PCV based on the algorithmic approach, emphasizing gradual reductions in ventilator support while monitoring patient response and readiness for extubation.
Anitha et al. discussed the use of controlled mechanical ventilation to achieve enhanced measurements from pressure and flow sensors12. By maintaining consistent and controlled airflow conditions, these sensors can deliver more accurate and reliable data on respiratory parameters. Rittayamai, in their article8, provides a detailed comparison and evaluation of pressure-controlled ventilation (PCV) and volume-controlled ventilation (VCV), focusing on their efficacy and outcomes in managing patients.
Baker, in his book elaborates the systems which leverage machine learning to dynamically sync ventilator support with the patient’s natural breathing efforts, thereby reducing the discomfort caused by asynchronous ventilation. Such intelligent control systems can predict and adjust to changes in lung conditions, enabling more personalized and precise ventilation management13. Mohanram and Ranganathan (2024) present a fuzzy logic-based current control method for regulating proportional flow control valves in medical ventilators. The approach enhances precision in airflow management, ensuring smoother and more responsive control for patient breathing assistance14.
Methodology
This section presents the different patterns of waveforms employed in the simulation of Pressure and Volume Control Ventilation. The step, ramp and cycloidal waveforms are applied for simulating a ventilator and the results are compared and discussed. These waveforms—step, ramp, and cycloidal—define how pressure or volume changes over time during the inspiratory phase of a ventilator cycle. Each waveform has distinct characteristics that affect the distribution of airflow, patient comfort, and the overall effectiveness of ventilation.
Step and ramp pattern waveforms used in the simulation of mechanical ventilation – limitations
The step and ramp pattern waveforms used in the simulation of mechanical ventilation are presented. The step waveform is characterized by an immediate rise to the target pressure or flow rate, which is then maintained at a constant level throughout the inspiratory phase. The ramp waveform, also known as a linear waveform, features a gradual increase in pressure or flow rate over the inspiratory phase. Instead of an immediate jump, the parameter rises steadily.
Figure 2a shows a typical cycle of pressure-controlled ventilation using a step pattern. In this case, the pressure is limited to a maximum peak inspiratory pressure (PIP) of 25 cmH2O. The inspiration cycle lasts for Tins= 1 s, followed by the expiration cycle, which lasts for Texp= 3 s. During inhalation, the pressure increases to PIP and during exhalation, it decreases to a plateau value of positive end-expiratory pressure (PEEP), which is 6 cmH2O.
Fig. 2.

Simulation of step pattern - pressure-controlled ventilation, (a) Variation of pressure,  for a single breath cycle, (b) Variation of
  for a single breath cycle
Figure 3a depicts pressure variation with a ramp pattern. Unlike the step pattern, the pressure gradually rises to the maximum PIP of 25 cmH2O. The time taken for this gradual rise to PIP is referred to as Trise, which in this example is 0.2 s. Similarly, during exhalation, the pressure decreases from PIP to PEEP over a duration of Tfall=0.2 s.
Fig. 3.

Simulation of ramp pattern - Pressure-controlled ventilation, (a) Variation of Pressure,  for a single breath cycle, (b) Variation of
  for a single breath cycle, (c) Variation of
  for a single breath cycle
Based on the step and ramp patterns, it is observed that at the changeover points, such as A1 and B1 (as shown in Fig. 2a), there is a noticeable steep change in the slope of the curve. This is depicted in Fig. 2b, where the abrupt transitions in the slope of the curve at these points are evident. In Fig. 2a, it can be observed that the pressure changes over time, as tracked by the first derivative of pressure  approaches infinity at the changeover points A2 and B2. This is illustrated in Fig. 2b, where the steep slopes at these points indicate an infinite rate of change in pressure. This phenomenon of abrupt changes in instantaneous pressure can lead to discomfort for the patient being ventilated9. It is important to minimize discomfort during mechanical ventilation to ensure a more comfortable and effective patient experience.
A similar sudden change in pressure can be observed in the ramp pattern, as shown in Fig. 3a. The changeover points are designated as C1, D1, E1, and F1. At these points, the first derivative of pressure  increases abruptly from 0 to 100 cmH₂O/s. The changeover values are detailed in Fig. 3b. Corresponding to the points C2, D2, E2, and F2, it can also be observed that the second derivative of pressure with respect to time
  reaches values approaching infinity at the changeover points C3, D3, E3, and F3, as shown in Fig. 3c. Such significant values of the second derivative can increase patient discomfort. Therefore, it is essential for the pressure variation over time to be smooth to minimize patient discomfort.
A similar phenomenon can be observed in volume control ventilation, where the changeover points are also critical and the details are not shown here for brevity. Table 1 lists the typical ventilator parameters used in the literature15-17, and the same was used in the simulation of different modes of ventilation.
Table 1.
Ventilator parameters – typical values considered for the present study as recommended in literature.
| Ventilator parameters | Unit | Recommended values for adults | Typical values considered for the study |
|---|---|---|---|
| Lung Compliance, C, | mL/cmH2O | 30 to 75 | 50 |
| Resistance, R | cmH2O/Lps | 10 to 30 | 25 or 13 |
| PIPmax (Peak Inspiratory Pressure) | cmH2O | Below 30 | 25 |
| PEEP (Positive End Expiratory Pressure) | cmH2O | 5 to 15 | 6 |
| Vt (Tidal Volume) | mL/kg | 6 to 8 |
7 (Age 50y) |
| Trise (Rise Time) (% of breath cycle) | s | 10–30% | 10–30% |
| Tfall (Fall Time) (% of breath cycle) | s | 10–30% | 10–30% |
| RR (Respiratory Rate) | Breaths/min | 12 to 20 | 15 |
| Inspiratory to Expiratory Ratio | - | 1:2 to 1:4 | 1:3 |
Cam analogy
In the analogy of motion of a typical machine element - cam, it is essential that the profile of the cam motion be smooth so that the third derivative of displacement i.e., the jerk is minimal so that the effects of inertia are reduced, especially when the cam is operating at high velocity. Rothbart et al.18 analysed three different cam profiles, such as Simple Harmonic, Parabolic, and Cycloidal. Out of these three, the cycloidal profile was found to have a finite value of higher-order derivatives of displacement. The cycloidal profile was found to have a finite value of the third derivative, which contributes to the smoother motion of the Cam when compared to the other profiles. A similar approach has been used in mechanical ventilation so that the discomfort of the patient can be minimized due to abrupt changes in pressure and flow.
Results and discussion
Cycloidal pattern
The cycloidal waveform, also known as a sinusoidal or harmonic waveform, is characterized by a smooth, curvilinear increase and decrease in pressure or flow rate. The rise and fall follow a sinusoidal pattern, creating a wave-like delivery.
In this section, the pressure pattern in pressure-controlled ventilation is simulated using a cycloidal profile, a method widely employed in cam mechanisms. To conduct the simulation, the governing equations for pressure, flow, and volume associated with the cycloidal profile for both rise and fall segments were derived, similar to the SIVA model4. The graphical representations of the pressure, flow, and volume parameters are illustrated in Fig. 4a, Fig. 4b, and Fig. 4c, respectively.
Fig. 4.
Simulation using cycloidal profile – PCV, (a) Pressure pattern (b) Flow pattern (c) Volume pattern.
The input parameters for simulating cycloidal profile, shown in Fig. 4(a), are shown in Table 2.
Table 2.
The input parameters applied to the cycloidal profile.
| Parameter | Set value |
|---|---|
| Profile | Cycloidal |
| Inspiration time, Tins | 1.00 s (Trise=0.2s, Tfall=0.2s) |
| Expiration time, Texp | 3.00 s |
| Peak inspiratory pressure, PIP | 25.00 cmH2O |
| Airway resistance, R * | 13.00 cmH2O/lps |
| Lung compliance, C * | 50 ml/ cmH2O |
*Typical values for an adult, that have been used in computation for discussion.
The equations derived for the various segments for PCV in Fig. 4 - Segment (1) to (8) are shown in Eq. (1) to Eq. (8).
 |
1 |
 |
2 |
 |
3 |
 |
4 |
 |
5 |
 |
6 |
 |
7 |
 |
8 |
Efforts have been made to maintain the common input parameters identical to the ramp pattern; for example, the rise time and the fall time are maintained in 0.2 s (i.e. Trise=0.2s, Tfall=0.2s).
Investigation of derivatives of cycloidal profile
A detailed examination of the simulation results for the cycloidal pattern of pressure-controlled ventilation, as depicted in Fig. 5a, identifies specific transition points where the cycloidal profile undergoes significant alterations, particularly highlighted in Fig. 5b. These transition points occur within the pressure range of 6 to 25 cmH2O. When the first and second derivatives of the profile are scrutinized to evaluate potential discomfort experienced by the patient, it is evident from Fig. 5b that the first derivative shows a gradual variation. This gradual change implies that the patient is likely to experience minimal discomfort during these transitions. Not only does the first derivative change gradually, but the second derivative, as illustrated in Fig. 5b, also exhibits a gradual variation during the inhalation phase, rise time, and fall time. Specifically, the peak value of the first derivative  , is 149 cmH2O/s [Fig. 5b], while the peak value of the second derivative
  , is limited to 2,341 cmH2O/s2 [Fig. 5c]. These values are finite, contrasting with the infinite values observed in step and ramp patterns, respectively. This clearly demonstrates that the cycloidal profile effectively limits the peak values of both first and second-order derivatives.
Fig. 5.

Transient analysis - Simulation using Cycloidal profile (PCV), (a) Pressure Variation for a single breath cycle, (b) Variation of  for a single breath cycle, (c) Variation of
  for a single breath cycle
During both inhalation and exhalation phases, the profiles and their derivatives exhibit gradual transitions, as shown in Fig. 5a,b,c. Consequently, such a cycloidal pattern could be optimally employed in the simulation of pressure-controlled ventilation for patients utilizing medical ventilators.
The higher values in the derivatives of STEP and RAMP (± ∞) as shown in Table 3 add to the discomfort of the patient. However, corresponding values in the case of cycloidal pattern is limited to a finite value. Thus, the analysis demonstrated that the cycloidal pattern results in a relatively jerk-free delivery of air and oxygen mixtures, thanks to the finite values of the derivatives in the pressure and flow curves.
Table 3.
Comparison of peak values of derivatives of STEP, RAMP & cycloidal waveforms at the transition points (for example pressure variation in PCV) for a given set of ventilator parameters.
| Derivatives of pressure | STEP | RAMP | Cycloidal |
|---|---|---|---|
| Breath pattern |
|
|

|
| Transition points | A1, B1 | C1, D1, E1, F1 | X1, Y1 |

|
± ∞ (A1, B1) |
± 100 cmH2O/s (D1, E1) |
± 149 cmH2O/s (X1, Y1) |

|
--- |
± ∞ (C1, D1, E1, F1) |
± 2341 cmH2O/s2 (X1, Y1) |
The pressure, volume, and flow pattern curves in pressure-controlled ventilation using three distinct pressure shapes—step, ramp, and cycloidal—are illustrated in Fig. 6a. The relevant parameters for the pressure-controlled ventilation were set as follows: Tins = 1 s, Texp = 3 s, Trise = Tfall=0.2 s, Peak Inspiratory Pressure (PIP) = 25 cmH2O, and Positive End-Expiratory Pressure (PEEP) = 6 cmH2O. It is observed that the tidal volumes delivered in the ramp and cycloidal shapes are not significantly different, with a slight reduction of 0.746 ml compared to the step shape, as shown in Fig. 6b. This difference is attributed to the reduced flow rate requirement, as indicated in Fig. 6c, which is necessary to maintain a gradual rise in the pressure pattern, as depicted in Fig. 6a. Consequently, the proposed cycloidal curves for the pressure pattern in pressure-controlled ventilation demonstrate a smoother transition, reducing the likelihood of jerks compared to the step and ramp forms, although there is a marginal decrease in tidal volume to 0.579 ml for the same ventilator parameter settings.
Fig. 6.

Comparison and analysis of Step, Ramp and Cycloidal profiles – PCV, (a) Pressure pattern (b) Volume pattern (c) Flow pattern.
Similar studies were extended to the simulation of volume-controlled ventilation using cycloidal profile for the inhalation phase as shown in Fig. 7. The typical input data for the above simulation purpose is shown in Table 4.
Fig. 7.

Flow, Volume and Pressure patterns for Volume Controlled Ventilation.
Table 4.
The input parameters for volume-controlled ventilation.
| Parameter | Set value |
|---|---|
| Profile | Cycloidal |
| Inspiration time, Tins | 1.00 s (Trise=0.2s, Tfall=0.2s) |
| Expiration time, Texp | 3.00 s |
| Maximum flow rate, Qmax | 27.51 lpm |
| Tidal volume, Vt | 0.367 l |
| Peak end exhalatory pressure, PEEP | 6.00 cmH2O |
| Airway resistance, R * | 13.00 cmH2O/lps |
| Lung compliance, C * | 54 ml/ cmH2O |
*Typical values for an adult, that have been used in computation for discussion.
The equations derived for the various segments for VCV in Fig. 7 - Segment (1) to (8) are shown in Eq. 9 to Eq. 16.
 |
9 |
 |
10 |
 |
11 |
 |
12 |
 |
13 |
 |
14 |
 |
15 |
 |
16 |
Normal breathing curve
To experimentally determine the breathing pattern of a normal, healthy adult, an experimental setup was constructed in the laboratory, as illustrated in Fig. 8.
Fig. 8.

Experimental setup for capturing the normal breathing pattern.
The (air + oxygen) flow data, both input and output, during the inhalation and exhalation phases of the individual were recorded using the Breath Analyser (Model No. CITRIX H4). This device is equipped with an output feature that allows digital data to be captured and subsequently analyzed on a PC.
A typical natural breathing curve of a healthy individual, experimentally measured, is presented in Fig. 9. It can be observed that this natural breath pattern closely resembles the curve seen in volume-controlled ventilation, as shown in Fig. 6. Consequently, the subsequent mathematical modeling was performed using a cycloidal profile for the rise and fall segments and a ramp pattern for the dwell segments of the volume-controlled ventilation. The experimentally measured flow and volume parameters corresponding to this typical breath pattern are detailed in Table 5.
Fig. 9.

Flow rate vs. Time graph – Natural Breathing.
Table 5.
The measured parameters for natural breath pattern.
| Parameter | Value | |
|---|---|---|
| Inspiration phase, Tins=2.160 s | Rise Time, Trise1 | 0.48 s |
| Dwell Time, Tdwell1 | 1.30 s | |
| Fall Time, Tfall1 | 0.38 s | |
| Expiration phase, Texp=2.160 s | Fall Time, Tfall2 | 0.26 s |
| Dwell Time, Tdwell2 | 1.48 s | |
| Rise Time, Trise2 | 0.42 s | |
| Maximum flowrate, Qmax1 | 24.33lpm | |
| Tidal volume, Vt | 0.672 l | |
The flow pattern was subsequently modelled using cycloidal profiles for the Trise and Tfall segments (specifically segments N1, N3, N4, and N6) of the inspiration and expiration phases. The model results were then compared with the actual flow data, as shown in Fig. 10. Curve fitting was performed using the Pearson Product Moment Correlation method9, and the coefficient of determination (r2) for the curve fitting process was established at 98%. This r2 value is considered satisfactory, as it exceeds the minimum recommended value of 95% for goodness of fit. The high r2 value confirms the adequacy of the cycloidal pattern used in modelling the breathing curve for Volume-Controlled Ventilation.
Fig. 10.

Modelling of natural breath pattern using cycloidal profile (N1 – N6).
The extracted flow equations for the inhalation and exhalation phases, following the cycloidal pattern are shown in Eq. (17) to Eq. (22).
The maximum and minimum values of flow during inhalation (Qmax1 = 24.33 lpm and Qmax2 = 22.24 lpm) and exhalation are shown in Fig. 10.
 |
17 |
 |
18 |
 |
19 |
 |
20 |
 |
21 |
 |
22 |
The usefulness of the above simulation results lies in their potential to optimize the inhalation flow characteristics of medical ventilators. This study provides valuable insights for designers of medical ventilators, enabling them to tailor different waveforms to better match the inhalation flow patterns needed for their patients.
Measured operational parameters
The operational parameters obtained from modelling the natural breath pattern using the cycloidal profile during the various phases, as illustrated in Fig. 10, are summarized in Table 6.
Table 6.
Mapping operational parameters from Cycloidal Profile to Natural Breath Pattern.
| Parameter | Value | |
|---|---|---|
| Inspiration phase, Tins=2.160 s | Rise time, Trise1 | 0.47 s |
| Dwell time, Tdwell1 | 1.31 s | |
| Fall time, Tfall1 | 0.38 s | |
| Maximum flowrate, Qmax1 | 24.33lpm | |
The lung parameter values used in the modelling to ensure an accurate match between the modelled curve and the actual breath profile:
R = 19.8cmH2O/lps, C = 75 ml/cmH2O.
Inferred value of PIP = 21.4 cmH2O.
The natural breathing curve, as shown in Fig. 11, exhibits minimal transient effects. Figure 11b, c display the transient analysis of the first and second derivatives of the flow rate for the natural breathing curve, as obtained from the Breath Analyser. The results indicate that the peak derivatives are finite. .
.
Fig. 11.

Transient analysis of flow rate of a typical natural breath, (a) Flow rate  - Natural breathing, (b) First Derivative of flow rate,
  , (c) Second derivate of flow rate,
The cycloidal profile offers several advantages in respiratory systems, particularly for assisted ventilation. It reduces jerk, ensuring smooth transitions in airflow, which minimizes strain on lung alveoli and provides a comfortable breathing experience. The continuous flow pattern decreases effort required for breathing, protecting delicate lung tissues. This efficient airflow enhances lung filling capacity, allowing for more oxygen intake with each breath. Overall, the cycloidal profile optimizes patient comfort and breathing efficiency, making it highly suitable for medical ventilation applications.
Further study has been conducted in order to improve the mathematical model of the breath patterns and a hybrid model with combined cycloidal and parabolic curve pattern was investigated and the results are shown in Fig. 12.
Fig. 12.

Modelling of natural breath using parabolic profile
Conclusion
This study explores the complexities of pressure and volume-controlled ventilation in medical ventilators, with a focus on waveform simulations and their impact on patient comfort. A review of existing literature and simulations using step and ramp patterns revealed that these waveforms often cause patient discomfort due to abrupt pressure and flow variations. To mitigate this issue, the study introduced and examined the use of a cycloidal pattern for the inhalation and exhalation phases, aiming for smoother transitions in pressure and flow and the same was verified. The mathematical models developed offer valuable insights for ventilator designers, presenting a viable alternative to traditional step and ramp profiles. While a comparative study shows a slight decrease in tidal volume with cycloidal profiles, they maintain alignment with natural breathing patterns. The cycloidal profile thus emerges as a promising solution, enhancing patient comfort and closely resembling natural breath patterns.
Electronic supplementary material
Below is the link to the electronic supplementary material.
Acknowledgements
We wish to acknowledge the management of PSG Institute of Technology and Applied Research for supporting throughout the research study.
Author contributions
All authors have reviewed the revised manuscript before the submission.
Data availability
The data generated and analyzed during this study are presented in the manuscript as waveforms. Standard waveforms and their mathematical modelling have been utilized to enhance patient comfort, with a focus on the derivatives of these standard waveforms.
Declarations
Competing interests
The authors declare no competing interests.
Footnotes
Publisher’s note
Springer Nature remains neutral with regard to jurisdictional claims in published maps and institutional affiliations.
References
- 1.Roubík, K., Ráfl, J., van Heerde, M. & Markhorst, D. G. Design and control of a demand flow system assuring spontaneous breathing of a patient connected to an HFO ventilator. IEEE Trans. Biomed. Eng.58 (11), 3225–3233 (2011). [DOI] [PubMed] [Google Scholar]
- 2.Borrello, M. Adaptive control of a proportional flow valve for critical care ventilators. In 2018 Annual American Control Conference (ACC) (pp. 104–109). IEEE. (2018), June.
- 3.Dexter, A., McNinch, N., Kaznoch, D. & Volsko, T. A. Validating lung models using the ASL 5000 breathing simulator. Simul. Healthc.13 (2), 117–123 (2018). [DOI] [PubMed] [Google Scholar]
- 4.Chatburn, R. L. Fundamentals of Mechanical Ventilation: A Short Course in the Theory and Application of Mechanical Ventilators (Mandu, 2003).
- 5.Cabello, B. & Mancebo, J. Work of breathing. Intensive Care Med.32, 1311–1314 (2006). [DOI] [PubMed] [Google Scholar]
- 6.Angus, D., Finfer, S., Gattioni, L. & Singer, M. Oxford Textbook of Critical care (Oxford University Press, 2019).
- 7.Park, H. & Park, D. Y. Comparative analysis on predictability of natural ventilation rate based on machine learning algorithms. Build. Environ.195, 107744 (2021). [Google Scholar]
- 8.Rittayamai, N. et al. Pressure-controlled vs volume-controlled ventilation in acute respiratory failure: a physiology-based narrative and systematic review. Chest148 (2), 340–355 (2015). [DOI] [PubMed] [Google Scholar]
- 9.Marini, J. J., Crooke, P. S. 3rd & Truwit, J. D. Determinants and limits of pressure-preset ventilation: a mathematical model of pressure control. J. Appl. Physiol.67 (3), 1081–1092 (1989). [DOI] [PubMed] [Google Scholar]
- 10.Deepa, M. M., Vidhyapriya, R., Aparna, M. K. & Yeswantra, M. R. Simulation of mathematical model of pressure controlled ventilation (PCV). Solid State Technol.63 (5), 5724–5732 (2020). [Google Scholar]
- 11.Ashworth, L. et al. Clinical management of pressure control ventilation: an algorithmic method of patient ventilatory management to address forgotten but important variables. J. Crit. Care. 43, 169–182 (2018). [DOI] [PubMed] [Google Scholar]
- 12.Anitha, T. & Gopu, G. Controlled mechanical ventilation for enhanced measurement in pressure and flow sensors. Measurement: Sens.16, 100054 (2021). [Google Scholar]
- 13.Baker, D. J. Artificial ventilation in the intensive care unit: an overview. In: Artificial ventilation. Springer, Cham. 10.1007/978-3-030-55408-8_11 (2020). [Google Scholar]
- 14.Mohanram, D. & Ranganathan, V. Fuzzy Logic-based current control logic for proportional flow control valve system of medical ventilators. In Proceedings of the Bulgarian Academy of Sciences (Vol. 77, No. 9, pp. 1331–1339). (2024), September.
- 15.Amato, M. B. et al. Driving pressure and survival in the acute respiratory distress syndrome. N. Engl. J. Med.372 (8), 747–755 (2015). [DOI] [PubMed] [Google Scholar]
- 16.Gattinoni, L. et al. Intensive care medicine in 2050: ARDS. Intensive Care Med.42 (1), 73–82 (2016). [Google Scholar]
- 17.ARDSNet Ventilation with lower tidal volumes as compared with traditional tidal volumes for acute lung injury and the acute respiratory distress syndrome. N. Engl. J. Med.342 (18), 1301–1308 (2000). [DOI] [PubMed] [Google Scholar]
- 18.Rothbart, H. A. & Eng, D. Polynomial series cam and curves fourier.Cam Design Handbook, 89. (2004).
Associated Data
This section collects any data citations, data availability statements, or supplementary materials included in this article.
Supplementary Materials
Data Availability Statement
The data generated and analyzed during this study are presented in the manuscript as waveforms. Standard waveforms and their mathematical modelling have been utilized to enhance patient comfort, with a focus on the derivatives of these standard waveforms.