

Abstract
Background
Dysgeusia is a distortion of the sense of taste whose prevalence and relationship with nutritional status in Metabolic dysfunction-associated Steatotic Liver Disease (MASLD)-related advanced chronic liver disease (ACLD) have never been systematically explored.
Methods
200 MASLD patients [60 ≤ F3 fibrosis, 70 compensated ACLD (cACLD), and 70 decompensated (dACLD)] were enrolled. At baseline, the Child–Pugh (CP) score was determined. Dietary habits, body composition, and frailty were evaluated. The European Working Group (EWGSOP2) criteria defined sarcopenia. Dysgeusia was assessed by the Dysgeusia-Total-Score (DTS). A visual analog scale identified appetite impairment (VASAI). During a 6-month follow-up, liver-related decompensation events (LRDEs) were recorded.
Results
The prevalence of dysgeusia increased with the liver disease progression, appearing significantly higher in ACLD compared with ≤ F3 (65.7% vs 5%, p:0.003), as well as in dACLD compared to cACLD patients (58.5 vs 7.1% p < 0.0001). On 41 dACLD patients presenting dysgeusia, 37 (90.2%) showed a significant impairment of appetite levels. In dACLD, the CP score was positively correlated with both DTS (R:0.742) and VASAI (R:0.704), as well as DTS was directly correlated with VASAI (R:0.765) (all p < 0.0001). Compared with dACLD patients without dysgeusia, dysgeusia-affected dACLD patients presented a lower daily protein intake (g/kg/die) (1.55 ± 0.192 vs 1.34 ± 0.15, p < 0.0001). Sarcopenia (70.7 vs 41.3%) and frailty (69.29 vs 37.9%) were significantly more prevalent in dysgeusia-affected dACLD individuals (both p < 0.0001). These patients showed a higher risk of LRDEs occurrence during the follow-up [HR:2.205; C.I. 95%:1.186–4.099; p:0.01]. Logistic regression analysis revealed dysgeusia (aOR: 3.32), appetite impairment (aOR:1.32), sarcopenia (aOR: 3.75), and frailty (aOR:3.03) significantly associated with this outcome (all p < 0.0001).
Conclusions
Dysgeusia appears predominant in MASLD-dACLD and, via appetite impairment, in a close relationship with malnutrition, sarcopenia, and frailty, negatively influencing patients' outcomes.
Supplementary Information
The online version contains supplementary material available at 10.1186/s12937-025-01074-z.
Keywords: Nutrition, Liver cirrhosis, Sarcopenia, Frailty, Translational Medicine
Introduction
Dysgeusia is an umbrella term embracing a wide spectrum of qualitative (parageusia, phantogeusia, cacogeusia, and aliageusia) and quantitative (hypogeusia, hypergeusia, and ageusia) taste disorders (TDs)[1]. Phlogistic processes of the oral cavity, various chronic systemic diseases, neuropathies, psychiatric conditions, and iatrogenic cures (drugs, chemotherapeutics, and radiotherapy treatments) constitute typical pathological contexts where the onset of dysgeusia is promoted [1]. Dysgeusia can significantly contribute to a critical impairment of appetite, determining long-term malnutrition [1].
In advanced chronic liver disease (ACLD), the prevalence of malnutrition increases according to the disease stage, ranging from 20% in patients with compensated ACLD (cACLD) to over 60% in decompensated (dACLD) subjects [2]. A close physio-pathological link between malnutrition, sarcopenia, and frailty has been described in dACLD patients with serious prognostic burdens [2–4].
Several variables, including the ascites favoring anorexia and early satiety, hepatic encephalopathy (HE) contributing to an altered level of consciousness, and improper dietary approaches (e.g. not adequately prescribed water restriction measures and poor palatability of low-sodic regimens), synergically fuel the reduction of appetite and daily food intake, promoting malnutrition onset in dACLD [2, 4, 5]. However, despite the combined efforts of hepatologists and nutritionists to prevent ascites and HE recurrence, as well as the proposal of tailored multidisciplinary interventions aiming to modify the dietary habits of dACLD patients, malnutrition, sarcopenia, and frailty, continue to configure a detrimental pathogenetic triangle affecting prognosis.
De facto, in this context, the hopes for management optimization to improve the outcomes of dACLD individuals disarmingly disappear, making the identification of new potentially modifiable promoters of this dramatic scenario an unmet need and a real social health challenge.
The prevalence of dysgeusia in ACLD individuals has been investigated by a seriously restricted number of past studies, mostly performed at the end of the last century. Anyway, this research has never concretely evaluated the relationship with liver disease progression status, and, above all, the repercussions on nutritional balance in these patients.
Even more relevantly, all previous observations have been limited to viral-related etiologies [chronic Hepatitis B virus infection (CHB) and chronic Hepatitis C virus infection (CHC)], without focusing on dysmetabolic contexts [6–8].
Nowadays, Metabolic dysfunction-associated Steatotic Liver Disease (MASLD) represents the predominant hepatopathy, as well as the leading cause of chronic liver damage, liver cirrhosis progression, and hepatocellular carcinoma (HCC) onset in Western countries [9]. Relevantly, in parallel with the continuous spreading of Metabolic Syndrome (MS) worldwide, according to the major epidemiological perspectives, MASLD appears destined to replace chronic viral-related liver disorders (CHB and CHC) progressively and completely in the next few years [10].
In this scenario, also considering the potential repercussions on therapeutic strategies supporting routine clinical management, dysgeusia configures a potentially “targetable” factor whose role in influencing appetite levels, and, indirectly, the nutritional status of MASLD-ACLD individuals deserves to be systematically defined.
Therefore, considering this background, the present observational study aims to explore the real prevalence of dysgeusia in MASLD-related ACLD patients, investigating the relationship with the appetite and liver disease progression status, as well as the association with the malnutrition-sarcopenia-frailty triangle, and the impact on hepatic-related prognosis.
Materials and methods
Experimental design
In this observational study, a cohort of MASLD outpatients, subsequently divided into mild-advanced hepatic fibrosis (≤ F3 fibrosis) and ACLD based on Liver Stiffness Measurement (LSM), as well as in MASLD-related cACLD [naïve for the onset of previous liver-related decompensation events (LRDEs) and MASLD-dACLD [defined by ongoing LRDEs or LRDEs occurrence in the last 12 months, without gaining recompensation [11, 12]] individuals, were consecutively enrolled.
As detailed below, at the enrollment, clinical-anthropometric data, biochemical variables, and nutritional parameters were collected, as well as the presence/absence of dysgeusia was assessed. During a six-month follow-up period, for dACLD patients, the onset of new LRDEs was recorded.
The prevalence of dysgeusia in dACLD patients compared with cACLD and ≤ F3 fibrosis ones represented the primary endpoint of this study. To investigate the relationship of dysgeusia with appetite levels and, indirectly, with the nutritional status in ACLD (cACLD and dACLD) patients, as well as the relative impact on the onset of further LRDEs in dACLD individuals, constituted the secondary endpoint. The experimental design is reported in Fig. 1.
Fig. 1.

Experimental flow-chart. LSM was adopted to discriminate ≤ F3 patients and ACLD individuals, whereas the evaluation of LRDEs’ occurrence (ongoing and in the previous 12 months) distinguished cACLD and dACLD patients. In particular, LRDEs were: (a) progressive jaundice in not-cholestatic disease, (b) ascites, (c) HE, (d) variceal bleeding, or (e) any acute bacterial infections. The evidence of esophageal varices defined CSPH. Anthropometric parameters included Systolic Blood Pressure (SBP), Diastolic Blood Pressure (DBP), Body Mass Index (BMI), and Waist-hip ratio (Whr) determination. Biochemical variables included platelet count (PLT), aspartate aminotransferase (AST), alanine aminotransferase (ALT), total bilirubin (TB), gamma-glutamyl transferase (GGT), alkaline phosphatase (ALP), Fasting Plasma Glucose (FPG), total cholesterol, High-density lipoprotein (HDL) cholesterol, low-density lipoprotein (LDL) cholesterol, triglycerides (TG), serum albumin (SA), International-Normalized Ratio (INR), and creatinine. For ACLD, the Child-Pugh-Turcotte score was determined. Nutritional counseling was offered to all the patients: for this purpose, dietary and physical exercise habits were assessed, as well as the presence of dysgeusia (see the main text) and appetite levels. Nutritional status, including the evaluation for sarcopenia and frailty, was opportunely defined by using bioelectrical impedance analysis (BIA) and Liver Frailty Index (LFI) calculation. During a 6-month follow-up period, further LRDEs were recorded for dACLD. At the baseline, as well as during the follow-up, LRDEs considered were (a) progressive jaundice in not-cholestatic disease, (b) ascites, (c) HE, (d) variceal bleeding, or (e) any acute bacterial infections. Jan: January; Dec: December; MASLD: Metabolic dysfunction-associated Steatotic Liver Disease; LSM: Liver stiffness measurement; ACLD: advanced chronic liver disease; cACLD: compensated advanced chronic liver disease; dACLD: decompensated advanced chronic liver disease. LRDEs: liver-related decompensation events; CSPH: Clinically Significant Portal Hypertension
Patients
This observational longitudinal study complies with the ethical guidelines of the Declaration of Helsinki (1975) and was approved by the ethical committee of the University of Campania Luigi Vanvitelli in Naples (prot n. 0016948/i-2023). The enrollment was carried out at the Hepato-Gastroenterology Division of the University of Campania Luigi Vanvitelli between January and December 2023.
Inclusion criteria were age over 18 years and a proven clinical history of MASLD diagnosed following the relatively updated multi-society Delphi consensus proposed criteria [13].
Exclusion criteria were: (a) chronic liver disorders otherwise than MASLD [CHB, CHC, and alcohol-related liver disorder (ALD), autoimmune hepatitis, chronic cholestasis]; (b) smoke and alcohol abuse history; (c) decompensated type 2 diabetes mellitus (T2DM); (d) severe gastroesophageal reflux disease (GERD); (e) cancer/leukemia/lymphoma diagnosis; (f) pregnancy; (g) psychological/psychiatric problems that could have invalidated the informed consent and/or could have determined taste alterations; (h) acute or chronic kidney diseases with glomerular filtration rate (GFR) < 30 mL/min; (i) previous Sars-CoV-2 infection causing taste alterations from long-Sars-CoV-2 infection or ongoing infection; (j) oral cavity neoplasia; glossitis/stomatitis, including those caused by iatrogenic radiation treatments of the head and neck region; (k) Sjögren's syndrome, rheumatoid arthritis, lupus erythematosus, psoriasis and other autoimmune diseases including thyroid diseases; (l) use of drugs for which taste disorders are reported among adverse drug reactions (ADRs), as well as zinc and vitamin A supplementation in the previous 6 months; (m) presence of eating disorders; (n) neuropathies as injury to the trigeminal and glossopharyngeal nerve, facial paralysis, brainstem tumors, head trauma, stroke, neuromas of the cerebellopontine angle, diabetic neuropathies, and multiple sclerosis. Alcohol consumption was evaluated by using the Alcohol Use Disorders Identification Test (AUDIT-C) questionnaire [14].
At the enrollment, Transient Elastography (TE) was adopted to determine LSM: according to the Baveno VII consensus, LSM values ≥ 15 kilopascals (kPa) discriminate ≤ F3 and ACLD [11]. Adhering to the clinical practice guidelines (CPGs), for ACLD patients, the evidence of ongoing LRDEs or the occurrence of LRDEs in the 12 months preceding the enrollment, without gaining recompensation [11, 12], identified dACLD. In detail, LRDEs were: (a) progressive jaundice in not-cholestatic disease, (b) ascites, (c) HE, (d) variceal bleeding, or (e) any acute bacterial infections [15].
At baseline, for each patient, anthropometrical evaluations included Systolic Blood Pressure (SBP) and Diastolic Blood Pressure (DBP) (mmHg) measurements, as well as Body Mass Index (BMI) calculation by dividing the weight (kg) by the square of height (m), and the waist-to-hip ratio (WHR) determination. In dACLD patients with ongoing severe ascites, BMI and WHR were obtained after Large Volume Paracentesis (LVP). SBP ≥ 130 with DBP ≥ 85 mmHg configured arterial hypertension, and a BMI > 30 identified obesity [13].
The biochemical variables included: platelet count (PLT) (count/mm3), aspartate aminotransferase (AST), alanine aminotransferase (ALT), gamma-glutamyl transferase (GGT), alkaline phosphatase (ALP) (U/l), total bilirubin (TB), Fasting Plasma Glucose (FPG), total cholesterol, High-density lipoprotein (HDL), Low-density lipoprotein (LDL), triglycerides (TG), creatinine (mg/dl), serum albumin (SA) (g/dl), and International-Normalized Ratio (INR). For ACLD patients, the Child–Pugh (CP) score was determined [16].
For all patients, we investigated pharmacological history [including the administration of recognized “disease-modifying drugs”: non-selective beta-blockers (NSBBs) and human albumin [17, 18]], as well as the presence of MASLD-related comorbidities (obesity, arterial hypertension, dyslipidemia, T2DM) [13]. The evidence of esophageal varices configured clinically significant portal hypertension (CSPH) [11].
Furthermore, specialized nutritional counseling evaluating dietary habits, physical exercise, and body composition was offered to all enrolled subjects. On this occasion, sarcopenia, frailty, dysgeusia, and appetite levels were also opportunely investigated. Finally, dACLD patients were followed for 6 months, and the onset of new LRDEs, opportunely recording those requiring hospitalization, was registered.
Liver stiffness measurement
LSM was performed using FibroScan® [version 502 (Echosens, Paris, France)] with M and XL probes [19]. We used the XL probe when the ultrasound-measured distance between the skin and the liver capsule was greater than 2.5 cm and/or when the patient's BMI was > 30. FibroScan® was performed by an expert physician obtaining 10 acceptable measurements, with the maximum number of attempts set at 20. The criteria proposed by Boursier et al. defined measurement as “very reliable” (IQR/M ≤ 0.1), “reliable” (0.1 < IQR/M ≤ 0:3 or IQR/M > 0.3 with LS median < 7.1 kPa), or “poorly reliable” (IQR/M > 0.3 with LS median ≥ 7.1 kPa [19, 20].
Nutritional assessment
Evaluation of physical exercise and dietary habits
The validated “International Physical Activity Questionnaire Short Form” (IPAQ-SF) was adopted to simultaneously assess the time spent on moderate physical exercise and sitting periods [21] (Supplementary File 1).
To assess dietary habits, individuals reported daily meal intake (types of food and quantity) in a dedicated electronic diary. The Winfood Software 2.0 package (Medimatica s.r.l., Martinsicuro, Italy) analyzed and processed the collected data. Based on the quantity and quality of foods consumed, the software analysis evaluated the percentage of macronutrients and micronutrients in each food, the grams per body weight (g/kg) daily assumed, and the energy intake (kcal/die) relative to a complete week (including weekends). According to the European Society for Clinical Nutrition and Metabolism (ESPEN) CPGs on the topic, the following cut-offs for malnutrition and muscle depletion in cirrhotic patients were adopted to oral diet-derived intake: a) total energy intake: ≥ 35 kcal/kg/die; b) protein intake ≥ 1.5 g/kg/die [22].
Body composition assessment
A multifrequency bioelectrical impedance analysis (BIA) system (BIA MC-980A, Tokyo, Japan) was used to perform the body composition assessment and simultaneously determine multicompartment body composition parameters. The BIA system, thanks to a series of types of machinery algorithms elaborated the Free Fat Mass (FFM), the Fat Mass (FM), the body cell mass (BCM), the extracellular cell mass (ECM), expressed both in percentage and kilograms (Kg), as well as the total body water (TBW) and Skeletal Muscle Mass (SM) (Kg).
SMM-Index (SMMI) was calculated by dividing the SMM by the square of the height (m2) [23], whereas the impedance index was determined by dividing the square of the height (m2) by R [24].
The following single sex-specific validate equations, for which a strong correlation with dual-energy X-ray absorptiometry (DXA)-determined values have been revealed [25], were adopted to estimate Appendicular SM (ASM): (a) ASM-Men = 0.197 × (impedance index) + 0.179 × (weight) −0.019; (b) ASM-Women = 0.221 × (impedance index) + 0.117 × (weight) + 0.881 [26]. Finally, ASM/h2 was obtained by dividing the ASM by the square of the height (m2) (Kg/m2).
To maximally standardize body composition measurements, the BIA was performed in the morning (constantly in the time slot between 8.00 a.m. and 9.00 a.m.), and all patients were fasting since the night before (i.e. last meal was permitted no later than midnight).
Furthermore, as well as for anthropometrics, in dACLD patients with ongoing severe ascites, all the BIA-assessed parameters were obtained after LVP.
Sarcopenia and frailty assessment
The following parameters were considered to assess sarcopenia: (a) muscle quantity, (b) muscle strength, and (c) physical performance [27]. Respectively, (a) the ASM/h2 estimated the muscle quantity, and (b) the hand-grip (HG) test, by using the digital dynamometer SUAVER® and obtaining the average of 3 consecutive measurements (Kg) for each patient, as well as the chair-stand test (measuring the times in seconds, considering 5 repetitions, required to get up from the chair) defined the muscle strength. Furtherly, (c) the timed-up and go (TUG) test (measuring the time in seconds required to get up from a chair, walk three meters, turn around, return to the chair, and sit down again), the gait speed test (measuring the velocity in m/second to complete a 4 m linear course), and the Short Physical Performance Battery (SPPB) [combining the results of the chair-stand test, gait-speed test, and a balance test (BT) evaluating the time in seconds holding 3 increasing difficulty positions “side-semi tandem-tandem”, ranging from a total score of 0–12] were adopted to define physical performance [27]. An impairment of muscle strength was determined by HGT < 27 kg in males (and < 16 kg in females) and chair-stand test > 15 s, whereas an SPBB < 8, a gait speed test < 0.8 m/second, and a TUG ≥ 20 s configured a physical performance reduction. An ASM/h2 < 7 kg/m2 (males) [< 5.5 kg/m2 (females)] defined muscle quantity impairment.
According to the revised criteria proposed by the European Working Group on Sarcopenia in Older People (EWGSOP2), sarcopenia was diagnosed when muscle strength impairment was revealed, and muscle quantity impairment or physical reduction was evidenced [27].
Liver Frailty Index™ (LFI) [28], non-invasively determined the relative frailty status. The frailty status was determined by using validated cut-offs: robustness (LFI < 3.2), prefrailty (LFI between 3.2 and 4.4), and frailty (LFI ≥ 4.5) [29] (Supplementary File 2).
Evaluation of dysgeusia and dysgeusia-related appetite levels
To assess the dysgeusia, all patients received a questionnaire composed of specific questions (items), fitting to ACLD features, opportunely extracted from the adapted Italian version of the validated CITAS questionnaire [30] (Supplementary Files 3A and 3B).
The questionnaire was composed of three sections for a total of 17 items, with a score from 1 to 5 for each question exploring taste-related features relative to the last six months. Since a dedicated visual analog scale (VAS) was separately predisposed to evaluate the appetite levels, “Item” 18, which normally assesses appetite in the original CITAS questionnaire, was herein not included.
Respecting the creator’s instructions [30], the total single score related to the 4 dimensions of TDs was calculated as follows: (1) Reduction of flavors (1st single score) = add the scores of questions from 2 to 6 and divide by 5; (2) Discomfort (2nd single score) = add the scores of questions from 13 to 17 and divide by 5; (3) Fantageusia and parageusia (3rd single score) = add the scores of questions from 10 to 12 and divide by 3; (4) General alterations in taste (4th single score) = add the score of question 1 to those of questions 7 to 9 and divide by 4 [30]. For a correct evaluation, no omissions were admitted. By adding the single scores, the “Dysgeusia Total Score” (DTS) was obtained. A Dysgeusia Total Score of > 4 sufficiently defined the dysgeusia (Supplementary File 3A and 3B).
Finally, the impairment of appetite levels was separately assessed by using an appetite-dedicated VAS (VASAI): each patient was required to circle numbers [ranging from 1 (no reduced appetite) to 5 (appetite reduced: “very very much”)] which best described his/her condition over the last six months. A VAS total ≥ 2 was sufficient to define an appetite impairment. The used VASAI follows the specific validated CITAS-item 18 and is reported in full in Supplementary File 4. Dysgeusia and appetite levels were assessed after LVP when dACLD patients presented ongoing severe ascites.
Statistical analysis
The sample size was estimated by using a chi-square test confronting two independent proportions, singularly predicting a 50% difference in the prevalence of subjects presenting dysgeusia in the dACLD group compared to cACLD, as well as in the cACLD compared with ≤ F3 group, (significance: 0.05, type II error: 0.1; power: 0.9) (STATA14 for MacOS) and resulted in n 50 individuals for each group.
Continuous data were described as mean and standard deviations, while categorical variables as n (%). The Kolmogorov–Smirnov test for normality was performed to evaluate if the parametric or non-parametric analysis should be applied. Mann–Whitney and t-test for independent groups, the Kruskal–Wallis test, or ANOVA test, with posthoc Dunn-Bonferroni or Tukey–Kramer analysis, according to the non-normal or normal distribution, were performed to compare the continuous variables.
Linear regression analysis was adopted to evaluate the relationship (R) between continuous variables. The log-rank test analysis with Kaplan–Meier curve comparison, including the time-to-event (TTE) analysis, was adopted to determine the risk (Hazard Ratio) (HR) and compare the cumulative incidence (incidence proportion) (IP) and incidence ratio rate (IRR) of further LRDEs in dACLD patients affected by dysgeusia compared to those not affected. Logistic regression (weighted by sex, age, diabetes, BMI, baseline CSPH, administration of NSBB, and human albumin administration) analysis was used to test the variables independently associated (Odds ratios) (OR) with further LRDE occurrence. Statistical significance was defined as p < 0.05 in a two-tailed test with a 95% confidence interval (C.I.). GraphPad Prism vs.10.1.1 was used to perform the analysis.
Results
Baseline characteristics of the study population
A total of 200 MASLD patients were consecutively enrolled in the present study: 60 (30%) with ≤ F3 fibrosis, 70 (35%) with cACLD, and 70 (35%) with dACLD. The participant flowchart is provided in Supplementary File 5.
Baseline biochemical and clinical features
The demographic data, anthropometric indexes, biochemical parameters, clinical variables, and non-invasive tools for assessing liver disease severity of the study population are reported in Table 1.
Table 1.
Demographic, anthropometric, biochemical, clinical, and non-invasive tools for the study population
| Demographic data |
< F3 (n:60) |
cACLD (n:70) |
dACLD (n:70) |
p-value of the comparison between the liver-disease stages |
| Male (n and %) | 34 (56.67%) | 37 (52.86%) | 34 (48.57%) |
< F3 vs cACLD: n.s.** cACLD vs dACLD: n.s.** < F3 vs dACLD: n.s.** |
| Age (mean ± SD) | 65.85 ± 12.22 | 65.11 ± 10.02 | 64.76 ± 12.62 |
< F3 vs cACLD: ns* cACLD vs dACLD: n.s.* < F3 vs dACLD: n.s.* |
| Anthropometric indexes |
< F3 (n:60) |
cACLD (n:70) |
dACLD (n:70) |
p-value* of the comparison between the liver-disease stages |
| Weight (Kg) | 80.50 ± 8.70 | 79.28 ± 9.96 | 78.85 ± 9.62 |
< F3 vs cACLD: n.s cACLD vs dACLD: n.s < F3 vs dACLD: n.s |
| Height (meter) | 1.70 ± 0.05 | 1.68 ± 0.07 | 1.70 ± 0.05 |
< F3 vs cACLD: n.s cACLD vs dACLD: n.s < F3 vs dACLD: n.s |
| Height square (mean ± SD) | 2.89 ± 0.19 | 2.83 ± 0.26 | 2.90 ± 0.18 |
< F3 vs cACLD: n.s cACLD vs dACLD: n.s < F3 vs dACLD: n.s |
| BMI (Kg/m2) | 29.96 ± 2.32 | 28.81 ± 2.24 | 27.25 ± 3.94*** |
< F3 vs cACLD: n.s cACLD vs dACLD: n.s < F3 vs dACLD: n.s |
| SBP (mmHg) | 127.3 ± 14.94 | 127.9 ± 14.44 | 128.1 ± 10.15 |
< F3 vs cACLD: n.s cACLD vs dACLD: n.s < F3 vs dACLD: n.s |
| DBP (mmHg) | 87.00 ± 9.751 | 87.29 ± 9.581 | 87.14 ± 7.735 |
< F3 vs cACLD: n.s cACLD vs dACLD: n.s < F3 vs dACLD: n.s |
| WHR (mean ± SD) | 1.42 ± 0.68 | 1.39 ± 0.51 | 1.38 ± 0.48*** |
< F3 vs cACLD: n.s cACLD vs dACLD: n.s < F3 vs dACLD: n.s |
|
Biochemical variables (mean ± SD) |
< F3 (n:60) |
cACLD (n:70) |
dACLD (n:70) |
p-value* of the comparison between the liver-disease stages |
| PLT (count/mm3) | 327.6 ± 215.2 | 201.8 ± 48.34 | 121.9 ± 39.83 |
< F3 vs cACLD: p < 0.0001 cACLD vs dACLD: p < 0.0001 < F3 vs dACLD: p < 0.0001 |
| AST (U/l) | 33.23 ± 11.97 | 58.49 ± 26.05 | 37.30 ± 20.99 |
< F3 vs cACLD: p 0.009 cACLD vs dACLD: p < 0.0001 < F3 vs dACLD: p 0.014 |
| ALT (U/l) | 44.83 ± 17.53 | 62.03 ± 18.9 | 56.21 ± 17.5 |
< F3 vs cACLD: p 0.002 cACLD vs dACLD: n.s < F3 vs dACLD: p 0.016 |
| TB (mg/dL) | 0.90 ± 0.21 | 2.62 ± 0.72 | 3.21 ± 2.83 |
< F3 vs cACLD: p < 0.0001 cACLD vs dACLD: n.s < F3 vs dACLD: p < 0.0001 |
| GGT (U/l) | 74.42 ± 57.81 | 65.84 ± 41.62 | 78.54 ± 32.80 |
< F3 vs cACLD: n.s cACLD vs dACLD: p 0.0015 < F3 vs dACLD: p 0.0106 |
| ALP (U/l) | 82.97 ± 22.22 | 88.84 ± 20.47 | 98.43 ± 16.36 |
< F3 vs cACLD: n.s cACLD vs dACLD: p < 0.0001 < F3 vs dACLD: p < 0.0001 |
| FPG (mg/dL) | 121.4 ± 19.52 | 120.0 ± 17.72 | 123.6 ± 14.62 |
< F3 vs cACLD: n.s cACLD vs dACLD: n.s < F3 vs dACLD: n.s |
| Total cholesterol (mg/dL) | 199.9 ± 46.18 | 179.3 ± 37.05 | 144.1 ± 38.11 |
< F3 vs cACLD: p 0.0116 cACLD vs dACLD: p < 0.0001 < F3 vs dACLD: p < 0.0001 |
| HDL (mg/dL) | 40.83 ± 10.44 | 45.39 ± 9.39 | 40.73 ± 7.47 |
< F3 vs cACLD: p 0.0050 cACLD vs dACLD: p 0.0037 < F3 vs dACLD: n.s |
| LDL (mg/dL) | 136.6 ± 35.85 | 120.0 ± 37.40 | 107.4 ± 27.79 |
< F3 vs cACLD: p 0.0177 cACLD vs dACLD: p 0.0054 < F3 vs dACLD: p < 0.0001 |
| TG (mg/dL) | 161.7 ± 69.54 | 133.5 ± 36.72 | 120.3 ± 41.98 |
< F3 vs cACLD: p 0.0432 cACLD vs dACLD: 0.0198 < F3 vs dACLD: p 0.0003 |
| SA (g/dL) | 4.33 ± 0.36 | 3.52 ± 0.79 | 2.98 ± 0.84 |
< F3 vs cACLD: p < 0.0001 cACLD vs dACLD: p:0.01 < F3 vs dACLD: p < 0.0001 |
| INR (mean ± SD) | 1.05 ± 0.04 | 1.26 ± 0.35 | 1.34 ± 0.41 |
< F3 vs cACLD: p < 0.0001 cACLD vs dACLD: n.s < F3 vs dACLD: p < 0.0001 |
| Creatinine (mg/dL) | 1.017 ± 0.09 | 1.11 ± 0.88 | 1.39 ± 0.58 |
< F3 vs cACLD: n.s cACLD vs dACLD: p 0.0298 < F3 vs dACLD: p 0.0004 |
| Clinical data |
< F3 (n:60) |
cACLD (n:70) |
dACLD (n:70) |
p-value** of the comparison between the liver-disease stages |
| T2DM (n and %) | 36 (60%) | 38 (54.29%) | 41 (58.57%) |
< F3 vs cACLD: n.s cACLD vs dACLD: n.s < F3 vs dACLD: n.s |
|
Dyslipidemia (n and %) |
33 (55%) | 35 (50%) | 32 (45.71%) |
< F3 vs cACLD: n.s cACLD vs dACLD: n.s < F3 vs dACLD: n.s |
|
Obesity (n and %) |
54 (90%) | 49 (70%) | 31 (44.29%) |
< F3 vs cACLD: p 0.0052 cACLD vs dACLD: p 0.003 < F3 vs dACLD: p < 0.0001 |
|
Hypertension (n and %) |
32 (53.33%) | 37 (52.86%) | 39 (55.71%) |
< F3 vs cACLD: n.s cACLD vs dACLD: n.s < F3 vs dACLD: n.s |
|
CSPH (n and %) |
/ | 5 (7.14%) | 53 (75.71%) |
< F3 vs cACLD: / cACLD vs dACLD: p < 0.0001 < F3 vs dACLD: / |
|
NSBB administration (n and %) |
2 (3.33%) | 6 (8.57%) | 39 (55.71%) |
< F3 vs cACLD: n.s cACLD vs dACLD: p < 0.001 < F3 vs dACLD: p < 0.0001 |
|
HA administration (n and %) |
/ | / | 18 (25.71%) | / |
|
NITs (mean ± SD) |
< F3 (n:60) |
cACLD (n:70) |
dACLD (n:70) |
p-value* of the comparison between the liver-disease stages |
| CPT (mean ± SD) | / | 5.91 ± 1.032 | 6.87 ± 0.94 |
< F3 vs cACLD: / cACLD vs dACLD: p < 0.0001 < F3 vs dACLD: / |
| LSM (kPa) | 6.62 ± 2.574 | 17.80 ± 0.9349 | 21.50 ± 4.034 |
< F3 vs cACLD: p < 0.0001 cACLD vs dACLD: p < 0.0001 < F3 vs dACLD: p < 0.0001 |
≤ F3 mild-advanced fibrosis, cACLD compensated advanced chronic liver disease, dACLD decompensated advanced chronic liver disease, n number, SD standard deviation, BMI body mass index, SBP systolic blood pressure, DBP diastolic blood pressure, WHR waist-hip ratio
*Mann–Whitney U test; Statistically significant differences (p < 0.05) are reported in bold; n.s.: not statistically significant
**Chi-square test analysis
***In dACLD patients presenting severe ascites (ongoing LRDE), BMI and WHR were determined after Large Volume Paracentesis (LVP); PLT: platelet count; AST: aspartate aminotransferase; ALT: alanine aminotransferase; TB: total bilirubin; GGT: gamma-glutamyl transferase; ALP: alkaline phosphatase; FPG: Fasting Plasma Glucose; HDL: high-density lipoprotein; LDL: low-density lipoprotein; TG: triglycerides; SA: serum albumin; INR: International Normalized Ratio; T2DM: type 2 diabetes mellitus; CSPH: clinically significant portal hypertension; NSBB: non-selective beta-blockers; HA: human albumin; NITs: non-invasive tools; CP: Child–Pugh score; LSM: liver stiffness measurement
Of 70 dACLD, 32 (45.71%) presented an ongoing decompensation. Details of ongoing and previous LRDEs for dACLD individuals are provided in Supplementary Table 1.
Regarding the dysmetabolic MASLD-related comorbidities, no differences were observed in the prevalence of hypertension, T2DM, and dyslipidemia, whereas the prevalence of obesity decreased progressively with the worsening of the liver disease, appearing significantly lower in dACLD compared to both cACLD and ≤ F3 fibrosis-affected patients (all p < 0.05) (Table 1). Finally, as expected, CP and LSM values increased with disease progression, consistently with the major prevalence of CSPH observed in the dACLD group (all p < 0.0001) (Table 1).
Baseline nutritional features
The proportion of patients engaging in "moderate active physical exercise" was consistent across all liver disease stages. General disparities in dietary habits and food intake across the three liver disease stages (≤ F3, cACLD, and dACLD), both in terms of total daily calories (kilocalories/day) and quality of daily macronutrient intake were highlighted. In detail, daily calorie intake, as well as the consumption of carbohydrates, proteins, and lipids, were significantly lower in dACLD patients compared to individuals with ≤ F3 fibrosis and cACLD (all p < 0.0001) (Supplementary Table 2).
The body composition analysis revealed no significant differences between ≤ F3 and cACLD groups, whereas substantial significant variations in several BIA-assessed parameters by comparing dACLD to cACLD and to ≤ F3-affected patients were evidenced. Mainly, a decreasing trend of FMM (Kg and %), SMM (Kg), and SMMI (Kg/m2) in parallel with the worsening of liver disease, contrasting in a progressive increase of FM (Kg and %) across ≤ F3, cACLD, and dACLD were highlighted (Supplementary Table 3).
Regarding the sarcopenia assessment, significant differences in all parameters defining muscle strength (a), muscle quantity (b), and physical performances (c) emerged among the study groups. Specifically, ASM/h2 (Kg/m2), HGT (Kg), SPBB (total score), and gait speed test (m/s) were significantly higher in ≤ F3-affected patients compared to cACLD and dACLD groups, as well as in cACLD compared to dACLD patients, in contrast with chair-stand (sec) and TUG test (sec), showing a progressive increase according to the worsening of liver disease (details in Table 2).
Table 2.
Sarcopenia and liver frailty assessment in study population groups
| Sarcopenia assessment |
< F3 (n:60) |
cACLD (n:70) |
dACLD (n:70) |
p-value* of the comparison between the liver-disease stages |
|
Muscle quantity (a) ASM/h2 (mean ± SD) |
9.89 ± 1.18 | 7.66 ± 1.08 | 6.31 ± 0.71 |
< F3 vs cACLD: p < 0.0001 cACLD vs dACLD: p < 0.0001 < F3 vs dACLD: p < 0.0001 |
| Muscle strength (b) |
< F3 (n:60) |
cACLD (n:70) |
dACLD (n:70) |
p-value* of the comparison between the liver-disease stages |
|
HGT (Kg) (mean ± SD) |
32.26 ± 1.44 | 28.54 ± 0.81 | 20.12 ± 2.67 |
< F3 vs cACLD: p < 0.0001 cACLD vs dACLD: p < 0.0001 < F3 vs dACLD: p < 0.0001 |
|
Chair stand (sec) (mean ± SD) |
11.12 ± 0.58 | 11.94 ± 1.25 | 16.75 ± 1.70 |
< F3 vs cACLD: p < 0.0001 cACLD vs dACLD: p < 0.0001 < F3 vs dACLD: p < 0.0001 |
| Physical performance (c) |
< F3 (n:60) |
cACLD (n:70) |
dACLD (n:70) |
p-value* of the comparison between the liver-disease stages |
|
SPBB (total score) (mean ± SD) |
10.48 ± 0.98 | 9.85 ± 1.05 | 4.37 ± 1.71 |
< F3 vs cACLD: p: 0.0012 cACLD vs dACLD: p < 0.0001 < F3 vs dACLD: p < 0.0001 |
|
TUG (sec) (mean ± SD) |
9.62 ± 0.89 | 15.25 ± 2.13 | 21.05 ± 1.17 |
< F3 vs cACLD: p < 0.0001 cACLD vs dACLD: p < 0.0001 < F3 vs dACLD: p < 0.0001 |
|
Gait speed test (m/s) (mean ± SD) |
1.26 ± 0.10 | 0.89 ± 0.07 | 0.66 ± 0.17 |
< F3 vs cACLD: p < 0.0001 cACLD vs dACLD: p < 0.0001 < F3 vs dACLD: p < 0.0001 |
| Prevalence of sarcopenia |
< F3 (n:60) |
cACLD (n:70) |
dACLD (n:70) |
p-value** of the comparison between the liver-disease stages |
|
Number (%) of patients |
3 (5%) | 14 (20%) | 41 (58.57%) |
< F3 vs cACLD: p < 0.0001 cACLD vs dACLD: p < 0.0001 < F3 vs dACLD: p < 0.0001 |
| Liver frailty assessment |
< F3 (n:60) |
cACLD (n:70) |
dACLD (n:70) |
p-value of the comparison between the liver-disease stages |
| LFI (mean ± SD) | 3.04 ± 0.08 | 3.47 ± 0.29 | 5.23 ± 0.46 |
< F3 vs cACLD: p* < 0.0001 cACLD vs dACLD: p* < 0.0001 < F3 vs dACLD: p* < 0.0001 |
|
Frail patients (number and %) |
5 (8.33%) | 18 (25.71%) | 39 (55.71%) |
< F3 vs cACLD: p** < 0.0001 cACLD vs dACLD: p** < 0.0001 < F3 vs dACLD: p** < 0.0001 |
|
Pre-frail patients (number and %) |
15 (25%) | 22 (31.43%) | 23 (32.86%) |
< F3 vs cACLD: n.s.** cACLD vs dACLD: n.s.** < F3 vs dACLD: n.s.** |
|
No-frail patients (number and %) |
40 (66.67%) | 30 (42.8%) | 8 (11.43%) |
< F3 vs cACLD: p**0.0082 cACLD vs dACLD: p** < 0.0001 < F3 vs dACLD: p** < 0.0001 |
ASM appendicular skeletal mass, h2 the square of the height, HGT hand-grip test, SPBB short physical performance battery, TUG timed-up and go, LFI liver frailty index, SD standard deviation, ≤ F3 mild-advanced fibrosis, ACLD advanced chronic liver disease, cACLD compensated advanced chronic liver disease, dACLD decompensated advanced chronic liver disease
*Mann–Whitney U test
**Chi-square test analysis; statistically significant differences (p < 0.05) are reported in bold
Concerning frailty, LFI values were significantly lower in ≤ F3-affected patients compared to cACLD and dACLD groups, as well as in cACLD compared to dACLD individuals (all p < 0.0001) (Table 2).
Consistently with these results, reflecting the liver disease progression status, the prevalences of sarcopenia and frailty were heterogeneous among the study groups [sarcopenic patients: 3 (5%) ≤ F3, 14 (20%) cACLD, 41 (58.57%) dACLD; frail patients: 5 (8.33%) ≤ F3, 18 (25.71%) cACLD, 39 (55.71%) dACLD], appearing significantly higher in dACLD compared to cACLD (sarcopenia: p < 0.0001; frailty: p < 0.0001) and ≤ F3-affected patients (sarcopenia and frailty, both p < 0.0001), as well as in cACLD compared to ≤ F3 subjects (sarcopenia: p < 0.0001; frailty: p < 0.0001) (Table 2).
Dysgeusia and liver disease progression status
The evaluation of the prevalence of dysgeusia among the study groups revealed a progressively increasing trend in parallel with the worsening of the liver disease stage. Detailly, only 3 (5%) patients with ≤ F3 fibrosis presented dysgeusia, contrasting with 46 out of 140 (32.8%) ACLD individuals (p < 0.05) (Fig. 2). Focusing on ACLD, the prevalence of dysgeusia was significantly higher in dACLD compared to cACLD patients [5 (7%) vs 41 (59%), (p < 0.0001)] (Fig. 2).
Fig. 2.
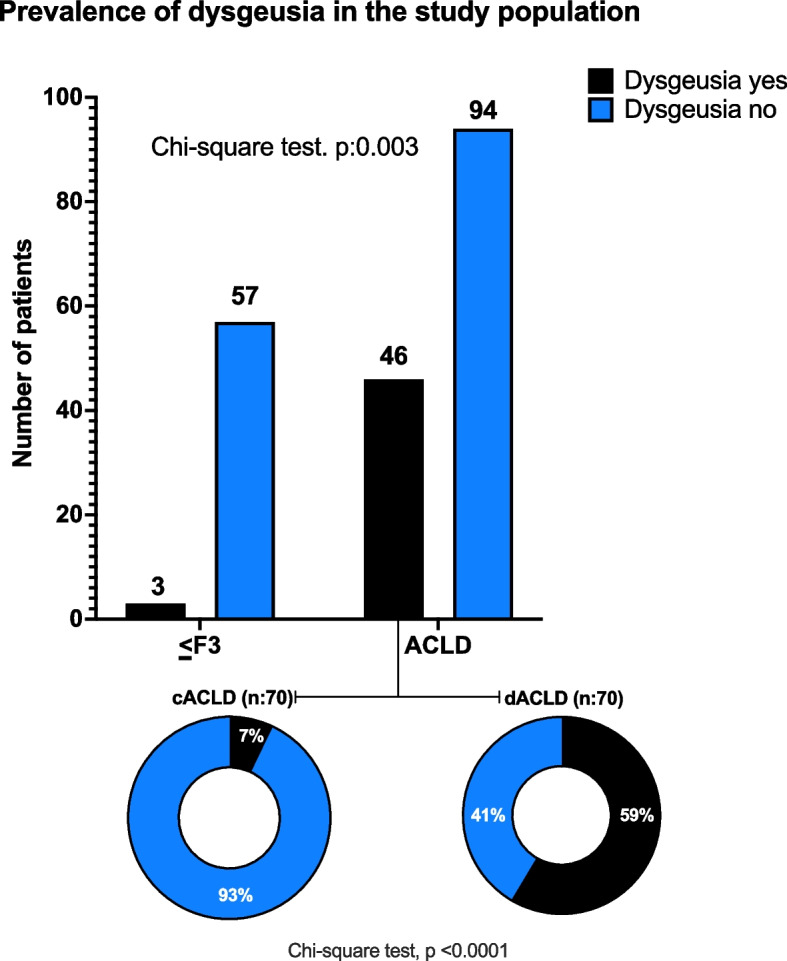
The prevalence of dysgeusia in the study population.The frequency distribution of dysgeusia in mild-advanced fibrosis (≤ F3) compared with ACLD, and in cACLD compared with dACLD patients. ACLD: advanced chronic liver disease; cACLD: compensated advanced chronic liver disease; dACLD: decompensated advanced chronic liver disease. Chi-square test analysis. Statistically significant differences (p < 0.05)
No statistically significant differences in terms of dysgeusia prevalence emerged when dACLD patients with ongoing decompensation and dACLD individuals with previous LRDEs were highlighted [ongoing: 19 out of 32 (59.37%) vs previous: 22 out of 38 (57.89%)].
Interestingly, stratifying for LRDE’s types, in patients with ongoing decompensation, dysgeusia was significantly represented (p:0.002) in the case of simultaneous ascites and HE [dysgeusia prevalence according to LRDE: ascites (9 out of 18) (50%); HE (2 out of 5) (40%); ascites + HE (8 out of 9) (88.8%)].
Dysgeusia and appetite levels
In dACLD subjects, DTS and VASAI values were both significantly higher compared to cACLD and ≤ F3-affected patients (DTS dACLD: 5.11 ± 2.64; DTS cACLD: 2.35 ± 1.05; DTS ≤ F3: 2.01 ± 0.81; VASAI dACLD: 3.07 ± 1.21; VASAI cACLD: 1.72 ± 0.61; VASAI ≤ F3: 1.01 ± 0.102, all p < 0.0001), whereas no significant difference was observed when ≤ F3 and cACLD individuals were compared. Consistently, the vast majority [37 of 41 (90.24%)] of dACLD patients presenting dysgeusia also showed appetite impairment. Exploring the relationship between dysgeusia severity, appetite impairment, and hepatofunctionality, a direct correlation of DTS with VASAI values (R: 0.765; CI: 95% 0.642–0.849; p < 0.0001), as well as a direct correlation of CP respectively with DTS (R:0.742; CI: 95% 0.609–0.834; p < 0.0001) and VASAI values (R: 0.704; CI: 95% 0.558–0.808, p < 0.0001) were highlighted in dACLD patients. On the contrary, no significant relationships were recorded in the cACLD group.
Dysgeusia and food intake
In dACLD patients, a significant difference in the quality of daily protein (g/kg/die) and total energy intake (kcal/kg/die) according to the presence of dysgeusia was also highlighted.
Concerning protein assumption, daily intake (g/kg/die) was significantly higher in dACLD patients without dysgeusia in comparison to dACLD subjects presenting this disorder (1.55 ± 0.192 vs 1.34 ± 0.15, p < 0.0001) (Fig. 3, Panel A). Moreover, in contrast to dACLD patients without dysgeusia (11 out of 29), the majority (33 out of 41) of dACLD individuals affected by dysgeusia showed a daily protein intake < 1.5 g/kg/die. Therefore, in this last setting, a higher prevalence of subjects with a daily protein intake < 1.5 g/kg/die was highlighted (p:0.0004) (Fig. 3, Panel B).
Fig. 3.

Daily food intake according to the presence of dysgeusia in decompensated patients. A Daily protein intake (g/kg/die) in dACLD patients presenting and not presenting dysgeusia dACLD: decompensated advanced chronic liver disease. Mann–Whitney test. Statistically significant differences (p < 0.05). B The prevalence of individuals presenting a daily protein intake under the CPGs-recommended cut-off (1.5 g/kg/die) in dACLD patients presenting and not presenting dysgeusia CPGs: clinical practice guidelines; dACLD: decompensated advanced chronic liver disease. Chi-square test analysis. Statistically significant differences (p < 0.05). C Total energy intake (kcal/kg/die) in dACLD patients presenting and not presenting dysgeusia dACLD: decompensated advanced chronic liver disease. Mann–Whitney test. Statistically significant differences (p < 0.05). D The prevalence of individuals presenting a total energy intake under the CPGs-recommended cut-off (35 kcal/kg/die) in dACLD patients presenting and not presenting dysgeusia. CPGs: clinical practice guidelines; dACLD: decompensated advanced chronic liver disease. Chi-square test analysis. Statistically significant differences (p < 0.05)
Finally, the daily total energy intake (kcal/kg/die) was significantly lower in dACLD patients presenting dysgeusia (patients without dysgeusia: 39.31 ± 3.01 vs patients with dysgeusia: 34.47 ± 1.502, p < 0.0001) (Fig. 3, Panel C).
Consistently, in this setting, a higher prevalence of individuals (4 out of 29 patients without dysgeusia vs 26 out of 41 patients with dysgeusia, p < 0.0001) presenting a daily total energy intake < 35 kcal/kg/die was revealed (Fig. 3, Panel D).
Dysgeusia and sarcopenia—frailty
Relevantly, the ASM/h2 (Kg/m2), the paramount parameter for assessing muscle quantity in sarcopenia, exhibited a significant decrease sequentially from ≤ F3 fibrosis (9.89 ± 1.18) to cACLD (7.66 ± 1.08), and from cACLD to dACLD (5.22 ± 1.45) (p < 0.0001). A statistically significant difference in ASM/h2 between dACLD patients presenting dysgeusia and dACLD individuals without dysgeusia (p < 0.0001) was also revealed (Fig. 4, Panel A). At the same time, LFI progressively increased from ≤ F3 fibrosis (3.04 ± 0.08) to cACLD (3.47 ± 0.29), and from cACLD to dACLD (5.21 ± 0.54) (p < 0.0001). A statistically significant difference in LFI between dACLD individuals affected by dysgeusia and dACLD patients without dysgeusia was also highlighted (Fig. 4, Panel B). Remarkably, the prevalence of sarcopenia and frailty increased with the progression of liver disease, simultaneously with the frequency distribution of dysgeusia. Specifically, as previously reported, sarcopenia was evidenced in 3 (5%) ≤ F3 fibrosis, 14 (20%) cACLD, and 41 (58.57%) dACLD patients (Table 2) (≤ F3 vs cACLD and cACLD vs dACLD, all p < 0.0001).
Fig. 4.

Sarcopenia and frailty according to the presence of dysgeusia and disease progression status. A Appendicula Skeletal Muscle Mass (ASM)/square of the height (ASM/h.2) values comparison in mild-advanced fibrosis (≤ F3), cACLD, dACLD without dysgeusia, and dACLD presenting dysgeusia. cACLD: compensated advanced chronic liver disease; dACLD: decompensated advanced chronic liver disease. Kruskal–Wallis test analysis. Statistically significant differences (p < 0.05). B Liver Frailty Index (LFI) values in mild-advanced fibrosis (≤ F3), cACLD, dACLD without dysgeusia, and dACLD presenting dysgeusia. cACLD: compensated advanced chronic liver disease; dACLD: decompensated advanced chronic liver disease. Kruskal–Wallis test analysis. Statistically significant differences (p < 0.05). C The prevalence of sarcopenia and D frailty mild-advanced fibrosis (≤ F3), cACLD, dACLD without dysgeusia, and dACLD with dysgeusia. Chi-square test analysis. Statistically significant differences (p < 0.05)
Relevantly, furtherly stratifying dACLD patients according to the presence of dysgeusia, sarcopenia appeared more represented in individuals affected by dysgeusia (29 out of 41) (70.73%) compared with subjects free from this disorder (12 out of 29) (41.37%) (p < 0.0001) (Fig. 4, Panel C).
Similarly, as previously revealed, frailty was evidenced in 5 (8.33%) < F3 fibrosis, 18 (25.71%) cACLD, and 39 (55.71%) dACLD patients (Table 2) (≤ F3 vs cACLD and cACLD vs dACLD, all p < 0.0001).
After stratifying dACLD according to dysgeusia, a major prevalence of frailty in subjects presenting dysgeusia (28 out of 41) (68.29%) compared with individuals free from this disorder (11 out of 29) (37.93%) was highlighted (Fig. 4, Panel D).
Liver-related decompensation events occurrence
The Kaplan–Meier Log-Rank Test analysis on the occurrence of further LRDEs during the follow-up period revealed a significantly elevated risk for dACLD patients presenting dysgeusia with appetite impairment [HR:2.205, C.I.95%:1.186–4.099], as well as a different Median Time of Decompensation (Median Time LRDEs), a higher cumulative incidence (IP), and a more elevated IRR in comparison to dACLD patients not presenting this disorder [Median Time LRDEs: 76 days vs 96.50 days; IP: 66.6% vs 41.3%; IRR: 40% vs 17.1%] (Fig. 5).
Fig. 5.

Liver-related decompensation events in dACLD according to the presence of dysgeusia. The occurrence of further liver-related decompensation events in dACLD patients presenting (blue) and not-presenting (black) dysgeusia. LRDEs: Liver-related decompensation events; HR: Hazard Ratio; Log-rank test analysis with Kaplan–Meier curve comparison; time-to-event (TTE) analysis; Statistically significant differences (p < 0.05)
In all 4 dACLD patients presenting dysgeusia without appetite impairment, an LRDE occurred during the 6 months and thus these subjects, in the analysis, were not split up and were comprehensively included in the group of dACLD patients presenting dysgeusia (Fig. 5).
Both in patients presenting dysgeusia and in individuals without this disorder, the ascites represented the most recurrent event observed during the follow-up requiring hospital admission in respectively 21.4 and 25% of cases. However, LRDEs requiring hospitalization were relevantly more frequently observed in dACLD patients with dysgeusia (46.42%) in comparison with dACLD individuals without dysgeusia (17.24%) (p < 0.0001). Supplementary Table 4 reports the distribution of LRDEs in dACLD during the 6 months, specifically identifying the events requiring hospitalization.
Distribution of males (sex), diabetes, CSPH, administration of NSBB and human albumin at a dosage of ≥ 40 g/week, age, and BMI over the median, was not significantly different in patients with and without dysgeusia, as well as comparing dysgeusia and not-dysgeusia affected presenting or not LRDEs (Supplementary Table 5). Finally, logistic regression analysis (weighted by sex, age, diabetes, BMI, baseline CSPH, administration of NSBB, and human albumin ≥ 40 g/week) revealed the CP score (aOR: 3.769, C.I.95%: 3.609–4.110), the LSM (aOR: 1.205, C.I. 95%: 1.003–1.480), the dysgeusia (aOR: 3.320, C.I. 95%: 2.486–3.732), the VASAI-defined appetite impairment (aOR:1.32, C.I. 95%: 2.486–3.732), the presence of sarcopenia (aOR: 3.750, C.I. 95%: 2.254–4.344), and the LFI (aOR:3.039, C.I. 95%: 2.179–4.091) as the variables significantly associated with further LRDEs occurrence in dACLD patients in the 6 months of follow-up (all p < 0.0001) (Fig. 6).
Fig. 6.

Adjusted Odds Ratios for clinical and nutritional variables associated with LRDEs occurrence in dACLD patients. LFI: Liver Frailty Index; LSM: Liver Stiffness Measurement; OR: Odds ratio; C.I.: Confidence Interval; Logistic regression model (adjusted for sex, age, diabetes, BMI, baseline CSPH, administration of NSBB, and human albumin); Statistically significant differences are reported in bold (p < 0.05)
Discussion
A plethora of pathophysiological evidence supports the perpetuation of malnutrition as a predisposing condition for sarcopenia and frailty in cirrhotic patients [31, 32]. Currently, the malnutrition-sarcopenia-frailty constitutes a “clinical triangle” surrounding and dramatically influencing the prognosis of ACLD patients, representing a significant socioeconomic health burden, in terms of increased risk of LRDE occurrence, frequency of hospitalizations, longer hospital stays, higher healthcare costs, and greater risk for hospital readmission and mortality [33].
An altered nutritional balance, sustained by inadequate nutrient intake and impaired appetite levels, has been recognized as the primum movens for malnutrition onset in this setting [34]. Based on this, for a long time, research has focused on the identification of variables promoting the nutritional imbalance in dACLD, revealing ascites favoring early satiety, HE-associated altered levels of consciousness, and improper dietary regimen prescriptions as the more relevant contributing factors [2, 4, 5, 34]. However, despite the atavistic efforts to adopt multidisciplinary approaches adequately and simultaneously targeting all the previously identified elements influencing appetite levels, malnutrition continues to represent a significant scourge for individuals with dACLD, as supported by epidemiological data and worrying projections [5].
Dysgeusia is a general distortion of the sense of taste significantly contributing to a critical impairment of appetite determining long-term malnutrition [1]. Considering this, dysgeusia may represent a heavy contributor to appetite reduction in patients with liver cirrhosis. However, the prevalence and relationship of dysgeusia with nutrition status in ACLD have never been systematically explored, since studies investigating taste disorders in cirrhosis were conducted decades ago and focused limitedly on viral etiology, not assessing the potential nutritional repercussions [6–8]. Therefore, an updated focus on TDs in this setting, considering the brutal change in the etiology of liver disease in favor of the metabolic prevalence (MASLD) over the viral [9, 10], as well as the possibility of using modern tools to explore the nutritional assets of these patients [4], appeared mandatory and constituted the main driver of the present research.
In this observational study, we consecutively enrolled 200 MASLD patients: 60 ≤ F3 affected fibrosis and 140 MASLD-related ACLD, of which 70 cACLD and 70 dACLD.
Of 70 dACLD, 32 (45.71%) showed an ongoing decompensation with ascites representing the most frequent (56.25%) ongoing LRDE, whereas the remaining part presented at least a previous decompensation event in the last 12 months without gaining recompensation [11, 12].
Exploring the prevalence of dysgeusia across the various liver disease progression stages, at the baseline, only an irrelevant portion (5%) of patients with ≤ F3 fibrosis presented this disorder, in contrast with a considerable part (33%) of ACLD individuals. Focusing on ACLD, a substantial difference in the frequency distribution of dysgeusia was highlighted between the cACLD (7%) and dACLD (59%) subjects. No statistically significant differences in terms of dysgeusia prevalence emerged when dACLD patients with ongoing decompensation and dACLD individuals with previous LRDEs were compared, relevantly suggesting the association of this TD in absolute with the liver disease progression status, rather than the current presence of decompensation. However, stratifying for LRDE’s types, in patients with ongoing decompensation, dysgeusia was significantly mostly represented (p:0.002) in the case of simultaneous ascites and HE. Notably, almost the whole of dACLD patients (90.24%) with dysgeusia presented also an appetite impairment, whereas no patient (neither cACLD nor dACLD), showed appetite impairment without having dysgeusia, supporting, as suspectable, the potential role of dysgeusia in reducing appetite levels and not vice-versa.
Based on these findings, we subsequently investigated the relationship between this TD and appetite impairment, as well as between dysgeusia, appetite impairment, and the progression of liver disease in both cACLD and dACLD patients. Exclusively in dACLD patients, a strong positive correlation between DTS and VASAI (R: 0.765; p < 0.0001), between CP score and DTS (R: 0.742; p < 0.0001), as well as between CP score and VASAI (R: 0.704; p < 0.0001) was highlighted.
These results outline a scenario in which, driven by the impairment of hepatofunctionality status (CP), the worsening of dysgeusia and appetite levels inexorably proceed in parallel in chronic liver disease-affected MASLD patients.
In light of this, it appeared conceivable to evaluate the relative repercussions of the above-revealed relationship on nutritional status by assessing the dietary habits with daily food intake, in all enrolled subjects. Globally, an impaired food intake, both in terms of daily protein and total energy intake, was reported in the dACLD individuals with dysgeusia. These patients showed lower daily protein intake and total energy intake in comparison to dACLD patients without dysgeusia. Consistently, a higher prevalence of individuals presenting a daily total energy intake < 35 kcal/kg/die and a protein intake < 1.5 g/kg/die was revealed in this setting.
Overall, these findings support the role of dysgeusia in promoting appetite impairment, potentially leading to malnutrition scenarios in dACLD patients, particularly with a deficit of daily protein intake. In the past, considering only partially the effects of ammonia on the genesis of HE, previous research reported an excess of protein intake was a precipitating factor of HE (and LRDEs) supporting the prescription of protein-restricted diets for cirrhotic patients [35]. New evidence has progressively completely subverted this approach: nowadays, protein represents a paramount dietary component for ACLD patients, playing a crucial role in avoiding protein-calorie malnutrition (PCM) and tissue wasting in this setting [36]. In line with this, the ESPEN guidelines on clinical nutrition in liver disease recommend a protein intake of at least 1.5 g/kg/day for these patients [22]. Considering the reported results in daily food intake, the subsequent body composition analysis, simultaneously with the evaluation of physical exercise in all the enrolled subjects, assumed even more relevance.
As expected, BIA mainly revealed a decreasing trend in FMM (Kg and %), SMM (Kg), and SMMI (Kg/m2) in parallel with the worsening of liver disease, contrasting with a progressive increase of FM (Kg and %) across < F3, cACLD, and dACLD, in front of no relevant differences across the study groups regarding the prevalence of patients practicing moderate exercise.
At this point, following the well-documented association between malnutrition-sarcopenia-frailty [2, 5], by determining, besides the directly BIA-assessed variables, also the other parameters defining muscle quantity (ASM/h2), muscle strength (HGT and chair stand), physical performance (SPBB, TUG, and gait speed), and frailty (LFI), we were able to estimate the prevalence of sarcopenia and frailty across the different liver disease progression stages, according to the presence of dysgeusia. Relevantly, 58.57% of decompensated patients (41.37% of dACLD without dysgeusia and 70.73% of dysgeusia-affected individuals) had sarcopenia vs. 20% of cACLD and only 5% of ≤ F3 individuals. Similarly, frailty was reported in 55.71% of dACLD (37.93% of dACLD without dysgeusia and 69.29% of dysgeusia-affected individuals) vs. 25.71% of cACLD and 8.33% of ≤ F3 patients. Comprehensively, these data present dACLD patients with dysgeusia as a malnourished population with a predominance of both sarcopenia and frailty.
Finally, to examine the concrete short-term impact of these emerging aspects on prognosis, hospitalizations, and potential healthcare costs, we followed dACLD patients for 6 months, registering the occurrence of any LRDE type, specifically reporting events requiring hospitalization.
Remarkably, dysgeusia-affected dACLD patients presented a higher risk [HR:2.205] of overall LRDEs compared with dACLD patients without dysgeusia in the 6 months of follow-up. During this period, LRDEs occurred in 41.38% of dACLD patients without dysgeusia, with a median time of 96.50 days, in contrast with the 68.29% of dACLD patients presenting dysgeusia with a median time of 76 days. Precisely, in all 4 dACLD patients presenting dysgeusia without appetite impairment, an LRDE occurred during the 6 months and thus these subjects, in the analysis, were not split up and were comprehensively included in the group of dACLD patients presenting dysgeusia.
Relevantly, LRDEs requiring hospitalization were substantially more frequently observed in dACLD patients with dysgeusia (46.42%) in comparison with dACLD individuals without dysgeusia (17.24%) (p < 0.0001).
Regarding the type of events requiring hospitalization, no statistically significant differences were reported: in dACLD patients without dysgeusia, the occurrence of grade 2/3 ascites was the more represented (25% of patients) LRDE followed by severe acute HE (16.6%), as well as in the dys-dACLD group (grade 2/3 ascites: 21.4%), followed in this setting by Severe Acute HE (10%), acute gastrointestinal bleeding (7.1%), and acute bacterial infection (7.1%).
Logistic regression analysis was performed adjusting for decompensation-associated (promoting or preventing) factors supported by evidence in literature including, diabetes [37], BMI [38], baseline CSPH [11], administration of NSBB [18], and human albumin [17]. Adjusted Odds Ratios for clinical and nutritional variables on LRDEs occurrence in dACLD patients revealed the CP score (aOR: 3.769), the LSM (aOR: 1.205), the dysgeusia (aOR: 3.320), the VASAI-defined appetite impairment (aOR:1.32), the presence of sarcopenia (aOR: 3.750,), and the LFI (aOR:3.039,) as the independent variables significantly associated with this outcome (all p < 0.0001).
All these emerging findings support the crucial role of dysgeusia as a critical contributor to reducing appetite levels and altering the nutritional balance in dACLD patients, as well as a driver towards the malnutrition-sarcopenia-frailty with burden repercussions on hepatic-determined prognosis.
However, our research presents various limitations. Firstly, to define dysgeusia, we used the DTS, which represents a surrogate compared to other direct tests [39] assessing taste alterations resulting from a self-compilated questionnaire potentially susceptible to measurement biases [40, 41]. However, in the present study, this score was calculated by using and readapting recognized items of the widely validated CITAS test [30]. Indeed, even if CITAS has been predominantly used in chemotherapy settings, we opportunely adapted the original items to fit with the requirements of dACLD patients. Moreover, to diagnose sarcopenia, the new EGWSOP2 criteria, reporting the ASM/h2 as the variable defining muscle quantity, were adopted [27]. Even though the muscle quantity was not directly (by performing Computerized tomography, MRI, DEXA) determined in our research, this parameter was equally obtained by using BIA-assessed variables included in a widely recognized and validated method [26]: a single sex-specific validate equations, for which a strong correlation with dual-energy X-ray absorptiometry (DXA)-determined values have been revealed, was adopted [25]. Anyway, according to the new EWGSOP2 criteria, contrary to the previous ones requiring evidence of muscle quantity impairment [42], sarcopenia is currently diagnosed when muscle strength impairment is revealed, and muscle quantity impairment or physical reduction is evidenced, which in our study were all determined by adopting the currently validated tests [27].
Finally, the monocentric nature of this study and the short follow-up period both represent other study limitations, suggesting at the same time the need for future multicentric observations and further insights, considering the prosecution of this research line, in the light of the easy reproducibility not requiring huge economic resources, a concrete investigative scenario.
To the best of our knowledge, the present study represents the first prospective evaluation in real life of dysgeusia prevalence in MASLD-related patients across the various stages of liver disease progression, exploring also the repercussions on appetite levels, nutrition status, and prognosis, representing a pioneering model for further investigations in this previously unexplored field.
Conclusion
In the “wild ocean” of MASLD, dysgeusia, via significantly impairing appetite level, represents a common disorder dramatically driving the dACLD patients towards the Bermuda “triangle” of malnutrition, sarcopenia, and frailty with critical repercussions on their prognosis.
In the era of Precision Medicine, the assessment of this TD should be routinely performed in clinical practice, as well as the development of novel strategies targeting dysgeusia encouraged, to optimize the management of MASLD-dACLD subjects.
Supplementary Information
Supplementary Material 1. A. International physical activity questionnaire. The validated “International Physical Activity Questionnaire Short Form” (IPAQ-SF) simultaneously assesses the time spent on moderate physical exercise and sitting periods. B. (Italian Version). Questionario internazionale sull'attività fisica. The validated “International Physical Activity Questionnaire Short Form” (IPAQ-SF) simultaneously assesses the time spent on moderate physical exercise and sitting periods (Italian version).
Supplementary Material 2. Sarcopenia and frailty assessment, and Liver Frailty Index (LFI) determination. Assessment of sarcopenia according to the revised criteria proposed by the European Working Group on Sarcopenia in Older People (EWGSOP2), based on muscle strength and quantity impairment, and physical performance reduction. Non-invasively determination of the relative frailty status and LFI.
Supplementary Material 3. A. Chemotherapy Induced Taste Alteration Scale (CITAS) questionnaire – Adapted ACLD version. Specific questions (items), fitting to ACLD features, opportunely extracted from the adapted Italian version of the validated CITAS questionnaire to assess dysgeusia total score (DTS). B. Questionario Chemotherapy Induced Taste Alteration Scale (CITAS) – Adattato per ACLD. Specific questions (items), fitting to ACLD features, opportunely extracted from the adapted Italian version of the validated CITAS questionnaire to assess dysgeusia total score (DTS) (Italian version).
Supplementary Material 4. A. Visual analog scale for appetite impairment levels “VASAI”. Appetite impairment definition by a visual analog scale. B. Scala analogica visiva per i livelli di compromissione dell’appetito “VASAI”. Appetite impairment definition by a visual analog scale. (Italian version).
Supplementary Material 5. The participant flowchart. Identification, inclusion, analysis, and follow-up criteria of patients recruited.
Supplementary Material 6. LRDEs’ pattern (ongoing and in the previous 12 months) in dACLD patients. Details of ongoing and previous LRDEs for dACLD individuals.
Supplementary Material 7. Nutritional assessment in study population groups. Definition of moderate active physical exercise, the duration of sitting periods in terms of hours per day, dietary habits, and food intake across the three liver disease stages (≤ F3, cACLD, and dACLD), both in terms of total daily calories (Kilocalories/day) and quality of daily macronutrient intake.
Supplementary Material 8. Body composition assessment in study population groups. Body composition assessment by bioelectrical impedance analysis (BIA) in the study population.
Supplementary Material 9. Frequency distribution of LRDE types occurred during the follow-up period in dACLD patients presenting and not presenting dysgeusia. The distribution of LRDEs in dACLD during the 6 months, specifically identifying the events requiring hospitalization, according to the presence of dysgeusia.
Supplementary Material 10. The sensitive analysis for outcomes stratified by sex, age, diabetes, BMI, CSPH, administration of NSBB, and human albumin. Distribution of males (sex), diabetes, CSPH, administration of NSBB and human albumin at a dosage of ≥ 40 g/week, age, and BMI over the median in patients with and without dysgeusia, and presenting or not LRDEs.
Acknowledgements
Not applicable.
Disclosure-conflict of interest
The authors declare no conflict of interest.
Abbreviations
- ACLD
Advanced Chronic Liver Diseas
- ADR
Adverse Drug Reactions
- ALD
Alcohol-related Liver Disorders
- ALP
Alkaline Phosphatase
- ALT
Alanine aminotransferase
- aOR
Adjusted Odds Ratio
- ASM
Appendicular Skeletal Muscle Mass
- AST
Aspartate aminotransferase
- BCM
Body Cell Mass
- BIA
Bioelectrical Impedance Analysis
- BMI
Body Mass Index
- BT
Balance Test
- cACLD
Compensated Advanced Chronic Liver Disease
- CHB
Chronic Hepatitis B virus infection
- CHC
Chronic Hepatitis C virus infection
- CITAS
Chemotherapy-Induced Taste Alteration Scale
- CP
Child–Pugh
- CSPH
Clinically Significant Portal Hypertension
- dACLD
Decompensated Advanced Chronic Liver Disease
- DBP
Diastolic Blood Pressure
- DTS
Dysgeusia Total Score
- dys-dACLD-AI
DACLD patients presenting dysgeusia and appetite impairment
- dys-dACLD
DACLD patients presenting dysgeusia
- ECM
Extracellular Cell Mass
- EWGSOP2
European Working Group on Sarcopenia in Older People 2
- FFM
Free Fat Mass
- FM
Fat Mass
- FPG
Fasting Plasma Glucose
- GFR
Glomerular Filtration Rate
- GGT
Gamma-Glutamyl Transferase
- HCC
Hepatocellular Carcinoma
- HDL
High-Density Lipoprotein
- HE
Hepatic Encephalopathy
- HGT
Hand-Grip Test
- HR
Hazard Ratio
- INR
International-Normalized Ratio
- IP
Incidence Proportion
- IPAQ-SF
International Physical Activity Questionnaire Short Form
- IRR
Incidence Ratio Rate
- LDL
Low-Density Lipoprotein
- LFI
Liver Frailty Index
- LRDE
Liver-related Decompensation Event
- LSM
Liver Stiffness Measurement
- LVP
Large Volume Paracentesis
- MASLD
Metabolic dysfunction-Associated Steatotic Liver Disease
- MS
Metabolic Syndrome
- NSBB
Non-selective beta-blocker
- OR
Odds Ratio
- PH
Portal Hypertension
- PLT
Platelet count
- RCT
Randomized Control Trials
- SA
Serum Albumin
- SBP
Systolic Blood Pressure
- SM
Skeletal Muscle Mass
- SMI
Skeletal Muscle Mass Index
- SPPB
Short Physical Performance Battery
- T2DM
Type 2 Diabetes Mellitus
- TB
Total Bilirubin
- TBW
Total Body Water
- TD
Taste Disorder
- TE
Transient Elastography
- TG
Triglycerides
- TUG test
Timed-up and go test
- VAS
Visual Analogue Scale
- VASAI
Visual Analogue Scale defined Appetite Impairment
- WHR
Waist-to-Hip Ratio
Authors’ contributions
M.R. and M.D.: guarantor of the article, conceptualization, methodology, investigation, and writing the original draft; F.D.N., C.N.: conceptualization, methodology, formal analysis, investigation, and writing the original draft. P.V., S.O., A.C.C., G.I., M.N.: investigation, resources, data curation, and visualization; A.F.: conceptualization, data curation, supervision. All authors approved the final version of the manuscript.
Funding
This research received no financial support.
Data availability
The data that support the findings of this study are available from the corresponding author upon reasonable request.
Declarations
Ethics approval and consent to participate
This study follows the Declaration of Helsinki (1975) and has been approved by the ethical committee of the University of Campania Luigi Vanvitelli in Naples (prot n. 0016948/i-2023). All study participants, or their legal guardians, provided informed written consent before study enrollment.
Consent for publication
Not applicable.
Competing interests
The authors declare no competing interests.
Footnotes
Publisher’s Note
Springer Nature remains neutral with regard to jurisdictional claims in published maps and institutional affiliations.
Marcello Dallio and Mario Romeo contributed equally to this work and share the first authorship.
References
- 1.Jafari A, Alaee A, Ghods K. The etiologies and considerations of dysgeusia: A review of literature. J Oral Biosci. 2021;63(4):319–26. [DOI] [PubMed] [Google Scholar]
- 2.Lai JC, Tandon P, Bernal W, Tapper EB, Ekong U, Dasarathy S, et al. Malnutrition, Frailty, and Sarcopenia in Patients With Cirrhosis: 2021 Practice Guidance by the American Association for the Study of Liver Diseases. Hepatol Baltim Md. 2021;74(3):1611–44. [DOI] [PMC free article] [PubMed] [Google Scholar]
- 3.Siddiqui ATS, Parkash O, Hashmi SA. Malnutrition and liver disease in a developing country. World J Gastroenterol. 2021;27(30):4985–98. [DOI] [PMC free article] [PubMed] [Google Scholar]
- 4.Buchard B, Boirie Y, Cassagnes L, Lamblin G, Coilly A, Abergel A. Assessment of Malnutrition, Sarcopenia and Frailty in Patients with Cirrhosis: Which Tools Should We Use in Clinical Practice? Nutrients. 2020;12(1):186. [DOI] [PMC free article] [PubMed] [Google Scholar]
- 5.Bunchorntavakul C, Reddy KR. Review article: malnutrition/sarcopenia and frailty in patients with cirrhosis. Aliment Pharmacol Ther. 2020;51(1):64–77. [DOI] [PubMed] [Google Scholar]
- 6.Madden AM, Bradbury W, Morgan MY. Taste perception in cirrhosis: its relationship to circulating micronutrients and food preferences. Hepatol Baltim Md. 1997;26(1):40–8. [DOI] [PubMed] [Google Scholar]
- 7.Sturniolo GC, D’Incà R, Parisi G, Giacomazzi F, Montino MC, D’Odorico A, et al. Taste alterations in liver cirrhosis: are they related to zinc deficiency? J Trace Elem Electrolytes Health Dis. 1992;6(1):15–9. [PubMed] [Google Scholar]
- 8.Garrett-Laster M, Russell RM, Jacques PF. Impairment of taste and olfaction in patients with cirrhosis: the role of vitamin A. Hum Nutr Clin Nutr. 1984;38(3):203–14. [PubMed] [Google Scholar]
- 9.Chan WK, Chuah KH, Rajaram RB, Lim LL, Ratnasingam J, Vethakkan SR. Metabolic Dysfunction-Associated Steatotic Liver Disease (MASLD): A State-of-the-Art Review. J Obes Metab Syndr. 2023;32(3):197–213. [DOI] [PMC free article] [PubMed] [Google Scholar]
- 10.Pimpin L, Cortez-Pinto H, Negro F, Corbould E, Lazarus JV, Webber L, et al. Burden of liver disease in Europe: Epidemiology and analysis of risk factors to identify prevention policies. J Hepatol. 2018;69(3):718–35. [DOI] [PubMed] [Google Scholar]
- 11.de Franchis R, Bosch J, Garcia-Tsao G, Reiberger T, Ripoll C, Baveno VII Faculty. Baveno VII - Renewing consensus in portal hypertension. J Hepatol. 2022;76(4):959–74. [DOI] [PMC free article] [PubMed]
- 12.Reiberger T, Hofer BS. The Baveno VII concept of cirrhosis recompensation. Dig Liver Dis Off J Ital Soc Gastroenterol Ital Assoc Study Liver. 2023;55(4):431–41. [DOI] [PubMed] [Google Scholar]
- 13.Rinella ME, Lazarus JV, Ratziu V, Francque SM, Sanyal AJ, Kanwal F, et al. A multisociety Delphi consensus statement on new fatty liver disease nomenclature. Hepatol Baltim Md. 2023;78(6):1966–86. [DOI] [PMC free article] [PubMed] [Google Scholar]
- 14.Saunders JB, Aasland OG, Babor TF, de la Fuente JR, Grant M. Development of the Alcohol Use Disorders Identification Test (AUDIT): WHO Collaborative Project on Early Detection of Persons with Harmful Alcohol Consumption–II. Addict Abingdon Engl. 1993;88(6):791–804. [DOI] [PubMed] [Google Scholar]
- 15.D’Amico G, Bernardi M, Angeli P. Towards a new definition of decompensated cirrhosis. J Hepatol. 2022;76(1):202–7. [DOI] [PubMed] [Google Scholar]
- 16.Tsoris A, Marlar CA. Use Of The Child Pugh Score In Liver Disease. In: StatPearls. Treasure Island (FL): StatPearls Publishing; 2024 [cited 2024 May 4]. Available from: http://www.ncbi.nlm.nih.gov/books/NBK542308/. [PubMed]
- 17.Caraceni P, Riggio O, Angeli P, Alessandria C, Neri S, Foschi FG, et al. Long-term albumin administration in decompensated cirrhosis (ANSWER): an open-label randomised trial. Lancet Lond Engl. 2018;391(10138):2417–29. [DOI] [PubMed] [Google Scholar]
- 18.Villanueva C, Albillos A, Genescà J, Garcia-Pagan JC, Calleja JL, Aracil C, et al. β blockers to prevent decompensation of cirrhosis in patients with clinically significant portal hypertension (PREDESCI): a randomised, double-blind, placebo-controlled, multicentre trial. Lancet Lond Engl. 2019;393(10181):1597–608. [DOI] [PubMed] [Google Scholar]
- 19.Boursier J, Zarski JP, de Ledinghen V, Rousselet MC, Sturm N, Lebail B, et al. Determination of reliability criteria for liver stiffness evaluation by transient elastography. Hepatol Baltim Md. 2013;57(3):1182–91. [DOI] [PubMed] [Google Scholar]
- 20.Peter J. Eddowes, Sasso M, Allison M, Tsochatzis E, Anstee QM, Sheridan D, et al. Accuracy of FibroScan Controlled Attenuation Parameter and Liver Stiffness Measurement in Assessing Steatosis and Fibrosis in Patients With Nonalcoholic Fatty Liver Disease. Gastroenterology. 2019;156(6):1717–30. [DOI] [PubMed]
- 21.Lee PH, Macfarlane DJ, Lam TH, Stewart SM. Validity of the International Physical Activity Questionnaire Short Form (IPAQ-SF): a systematic review. Int J Behav Nutr Phys Act. 2011;21(8):115. [DOI] [PMC free article] [PubMed] [Google Scholar]
- 22.Plauth M, Bernal W, Dasarathy S, Merli M, Plank LD, Schütz T, et al. ESPEN guideline on clinical nutrition in liver disease. Clin Nutr Edinb Scotl. 2019;38(2):485–521. [DOI] [PMC free article] [PubMed] [Google Scholar]
- 23.Walowski CO, Braun W, Maisch MJ, Jensen B, Peine S, Norman K, et al. Reference Values for Skeletal Muscle Mass - Current Concepts and Methodological Considerations. Nutrients. 2020;12(3):755. [DOI] [PMC free article] [PubMed] [Google Scholar]
- 24.Kushner RF, Schoeller DA, Fjeld CR, Danford L. Is the impedance index (ht2/R) significant in predicting total body water? Am J Clin Nutr. 1992;56(5):835–9. [DOI] [PubMed] [Google Scholar]
- 25.Yu SCY, Powell A, Khow KSF, Visvanathan R. The Performance of Five Bioelectrical Impedance Analysis Prediction Equations against Dual X-ray Absorptiometry in Estimating Appendicular Skeletal Muscle Mass in an Adult Australian Population. Nutrients. 2016;8(4):189. [DOI] [PMC free article] [PubMed] [Google Scholar]
- 26.Yoshida D, Shimada H, Park H, Anan Y, Ito T, Harada A, et al. Development of an equation for estimating appendicular skeletal muscle mass in Japanese older adults using bioelectrical impedance analysis. Geriatr Gerontol Int. 2014;14(4):851–7. [DOI] [PubMed] [Google Scholar]
- 27.Cruz-Jentoft AJ, Bahat G, Bauer J, Boirie Y, Bruyère O, Cederholm T, et al. Sarcopenia: revised European consensus on definition and diagnosis. Age Ageing. 2019;48(4):601. [DOI] [PMC free article] [PubMed] [Google Scholar]
- 28.Kaps L, Lukac L, Michel M, Kremer WM, Hilscher M, Gairing SJ, et al. Liver Frailty Index for Prediction of Short-Term Rehospitalization in Patients with Liver Cirrhosis. Diagn Basel Switz. 2022;12(5):1069. [DOI] [PMC free article] [PubMed] [Google Scholar]
- 29.Lai JC, Covinsky KE, Dodge JL, Boscardin WJ, Segev DL, Roberts JP, et al. Development of a novel frailty index to predict mortality in patients with end-stage liver disease. Hepatol Baltim Md. 2017;66(2):564–74. [DOI] [PMC free article] [PubMed] [Google Scholar]
- 30.Campagna S, Gonella S, Stuardi M, Sperlinga R, Cerponi M, Olivero M, et al. Italian validation of the Chemotherapy Induced Taste Alteration Scale. Assist Inferm E Ric AIR. 2016;35(1):22–8. [DOI] [PubMed] [Google Scholar]
- 31.Sieber CC. Malnutrition and sarcopenia. Aging Clin Exp Res. 2019;31(6):793–8. [DOI] [PubMed] [Google Scholar]
- 32.Roberts S, Collins P, Rattray M. Identifying and Managing Malnutrition, Frailty and Sarcopenia in the Community: A Narrative Review. Nutrients. 2021;13(7):2316. [DOI] [PMC free article] [PubMed] [Google Scholar]
- 33.Daly RM, Iuliano S, Fyfe JJ, Scott D, Kirk B, Thompson MQ, et al. Screening, Diagnosis and Management of Sarcopenia and Frailty in Hospitalized Older Adults: Recommendations from the Australian and New Zealand Society for Sarcopenia and Frailty Research (ANZSSFR) Expert Working Group. J Nutr Health Aging. 2022;26(6):637–51. [DOI] [PubMed] [Google Scholar]
- 34.Ishizu Y, Ishigami M, Honda T, Imai N, Ito T, Yamamoto K, et al. Decreased appetite is associated with the presence of sarcopenia in patients with cirrhosis. Nutr Burbank Los Angel Cty Calif. 2022;103–104:111807. [DOI] [PubMed] [Google Scholar]
- 35.Zavaglia C, Brivio M, Losacco E, Onida L. The dietary protein contribution and hepatic encephalopathy in cirrhosis. Recenti Prog Med. 1992;83(4):218–23. [PubMed] [Google Scholar]
- 36.Eghtesad S, Poustchi H, Malekzadeh R. Malnutrition in liver cirrhosis:the influence of protein and sodium. Middle East J Dig Dis. 2013;5(2):65–75. [PMC free article] [PubMed] [Google Scholar]
- 37.Huang DQ, Noureddin N, Ajmera V, Amangurbanova M, Bettencourt R, Truong E, et al. Type 2 diabetes, hepatic decompensation, and hepatocellular carcinoma in patients with non-alcoholic fatty liver disease: an individual participant-level data meta-analysis. Lancet Gastroenterol Hepatol. 2023;8(9):829–36. [DOI] [PMC free article] [PubMed] [Google Scholar]
- 38.Berzigotti A, Garcia-Tsao G, Bosch J, Grace ND, Burroughs AK, Morillas R, et al. Obesity is an independent risk factor for clinical decompensation in patients with cirrhosis. Hepatol Baltim Md. 2011;54(2):555–61. [DOI] [PMC free article] [PubMed] [Google Scholar]
- 39.Payne T, Kronenbuerger M, Wong G. Gustatory Testing. In: StatPearls. Treasure Island (FL): StatPearls Publishing; 2024 [cited 2024 May 23]. Available from: http://www.ncbi.nlm.nih.gov/books/NBK567734/. [PubMed]
- 40.Groenvold M, Bjorner JB, Klee MC, Kreiner S. Test for item bias in a quality of life questionnaire. J Clin Epidemiol. 1995;48(6):805–16. [DOI] [PubMed] [Google Scholar]
- 41.Shelley A, Horner K. Questionnaire surveys - sources of error and implications for design, reporting and appraisal. Br Dent J. 2021;230(4):251–8. [DOI] [PubMed] [Google Scholar]
- 42.Cruz-Jentoft AJ, Baeyens JP, Bauer JM, Boirie Y, Cederholm T, Landi F, et al. Sarcopenia: European consensus on definition and diagnosis: Report of the European Working Group on Sarcopenia in Older People. Age Ageing. 2010;39(4):412–23. [DOI] [PMC free article] [PubMed] [Google Scholar]
Associated Data
This section collects any data citations, data availability statements, or supplementary materials included in this article.
Supplementary Materials
Supplementary Material 1. A. International physical activity questionnaire. The validated “International Physical Activity Questionnaire Short Form” (IPAQ-SF) simultaneously assesses the time spent on moderate physical exercise and sitting periods. B. (Italian Version). Questionario internazionale sull'attività fisica. The validated “International Physical Activity Questionnaire Short Form” (IPAQ-SF) simultaneously assesses the time spent on moderate physical exercise and sitting periods (Italian version).
Supplementary Material 2. Sarcopenia and frailty assessment, and Liver Frailty Index (LFI) determination. Assessment of sarcopenia according to the revised criteria proposed by the European Working Group on Sarcopenia in Older People (EWGSOP2), based on muscle strength and quantity impairment, and physical performance reduction. Non-invasively determination of the relative frailty status and LFI.
Supplementary Material 3. A. Chemotherapy Induced Taste Alteration Scale (CITAS) questionnaire – Adapted ACLD version. Specific questions (items), fitting to ACLD features, opportunely extracted from the adapted Italian version of the validated CITAS questionnaire to assess dysgeusia total score (DTS). B. Questionario Chemotherapy Induced Taste Alteration Scale (CITAS) – Adattato per ACLD. Specific questions (items), fitting to ACLD features, opportunely extracted from the adapted Italian version of the validated CITAS questionnaire to assess dysgeusia total score (DTS) (Italian version).
Supplementary Material 4. A. Visual analog scale for appetite impairment levels “VASAI”. Appetite impairment definition by a visual analog scale. B. Scala analogica visiva per i livelli di compromissione dell’appetito “VASAI”. Appetite impairment definition by a visual analog scale. (Italian version).
Supplementary Material 5. The participant flowchart. Identification, inclusion, analysis, and follow-up criteria of patients recruited.
Supplementary Material 6. LRDEs’ pattern (ongoing and in the previous 12 months) in dACLD patients. Details of ongoing and previous LRDEs for dACLD individuals.
Supplementary Material 7. Nutritional assessment in study population groups. Definition of moderate active physical exercise, the duration of sitting periods in terms of hours per day, dietary habits, and food intake across the three liver disease stages (≤ F3, cACLD, and dACLD), both in terms of total daily calories (Kilocalories/day) and quality of daily macronutrient intake.
Supplementary Material 8. Body composition assessment in study population groups. Body composition assessment by bioelectrical impedance analysis (BIA) in the study population.
Supplementary Material 9. Frequency distribution of LRDE types occurred during the follow-up period in dACLD patients presenting and not presenting dysgeusia. The distribution of LRDEs in dACLD during the 6 months, specifically identifying the events requiring hospitalization, according to the presence of dysgeusia.
Supplementary Material 10. The sensitive analysis for outcomes stratified by sex, age, diabetes, BMI, CSPH, administration of NSBB, and human albumin. Distribution of males (sex), diabetes, CSPH, administration of NSBB and human albumin at a dosage of ≥ 40 g/week, age, and BMI over the median in patients with and without dysgeusia, and presenting or not LRDEs.
Data Availability Statement
The data that support the findings of this study are available from the corresponding author upon reasonable request.