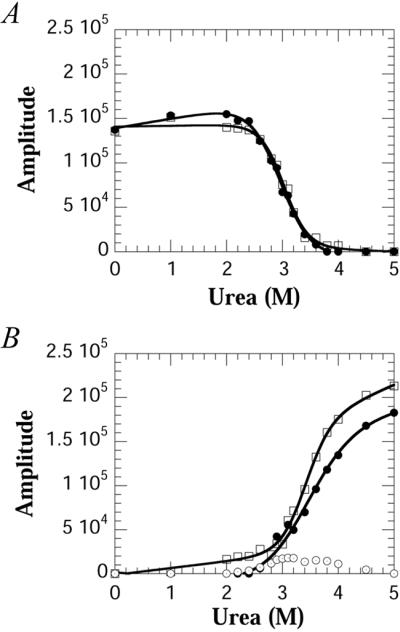
Figure 3.

Amplitudes obtained by using Bayesian analysis of the data in Fig. 2A as a function of urea. (A) Amplitudes of the folded resonances of Trp-36 (□) and Trp-128 (●) (B) Amplitudes of the unfolded resonances of Trp-36 (□), Trp-128 (●), and the intermediate resonance of Trp-128 (⊙). Note in B the amplitude of the intermediate resonance which is present above the denaturation midpoint.
