
Figure 4.
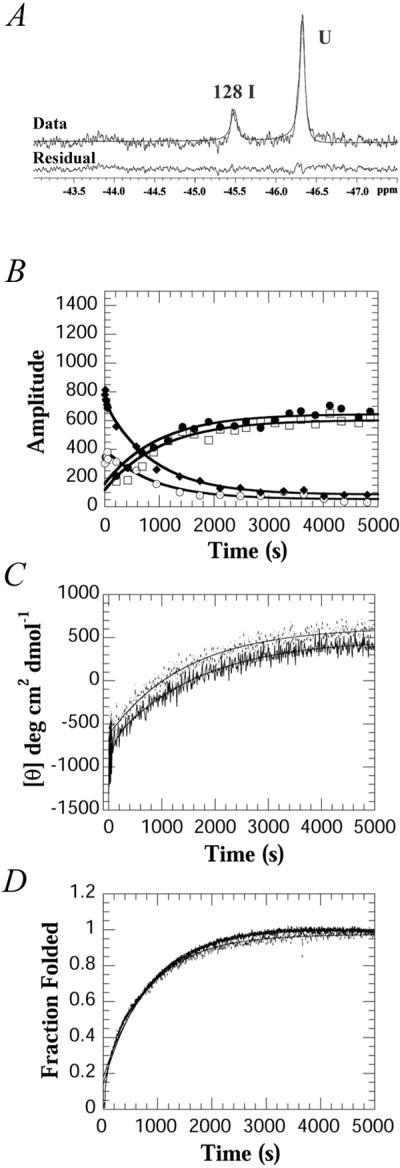
Stopped-flow 19F-NMR, CD and fluorescence kinetic data of PapD on changing the urea concentration from 4.5 to 2.25 M urea. (A) Initial 19F-NMR spectrum of PapD obtained 1.24 s after mixing. The data represent 64 transients collected from 64 separate injections at a final concentration of 70 μM, 20°C. (B) Amplitudes of the kinetic data for the folded resonances of Trp-36 (□) and Trp-128 (●), the intermediate resonance of Trp-128 (⊙), and the unfolded resonance (♦), obtained by Bayesian analysis. The line through each curve represents the fit to a sum of two exponentials. (C) Time dependence of the CD change at 233 nm for WT (---) and 19F-labeled (—). (D) Time dependence of the fluorescence change WT (---) and 19F-labeled (—). The fluorescence data were normalized to the fraction folded by using the equation F = ([Fl] − [Fl]u)/([Fl]n − [Fl]u) where Fl represents the fluorescence.