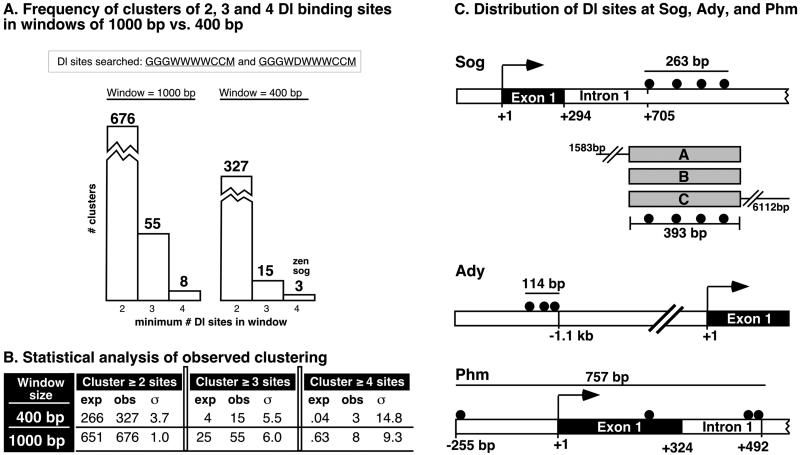
Figure 2.
Distribution of Dl clusters. (A) Frequency of clusters in genome containing a minimum of two, three, or four Dl binding sites in intervals of 1,000 or 400 bp. The Dl sequences searched are represented by the degenerate sequences GGGWWWWCCM and GGGWDWWWCCM, which encode a total of 208 unique sequences. Of the three clusters found to contain four sites in 400 bp, one is associated with zen and another with sog. (B) Statistical analysis of the expected (exp) vs. observed (obs) numbers of clusters with two, three, and four Dl sites found in windows of 1,000 and 400 bp. The number of observed clusters of three and four sites are many standard deviations (σ) from their expected frequencies, suggesting that their occurrence at the observed frequencies is not a random event. See Materials and Methods for details. (C) Distribution of Dl binding sites associated with sog, Ady, and Phm. Illustrated below the sog cluster are the three DNA fragments (sog A, B, and C) that were tested for regulatory activities in transgenic embryos.

