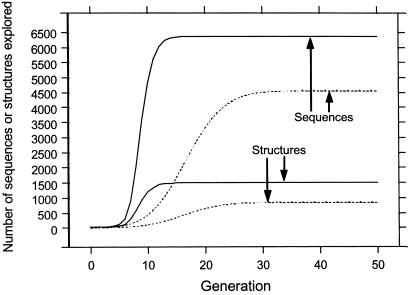
Figure 2.
Sequence and structure exploration. As indicated, the curves show the average number of distinct unique sequences visited or the average number of distinct structures these sequences encode, over 4,553 explorations, each using one of the model protein sequences in the largest net (Table 1) as the starting point at generation 0. Exploration proceeds at any given generation to the next by including new unique sequences from (i) all possible single point mutations on all unique sequences visited thus far (dotted curves, point mutations only) or (ii) all possible crossovers between every pair of unique sequences visited thus far and those from (i) (solid curves, point mutations plus crossovers).

