

ABSTRACT
The T‐cell receptor sequences expressed on cells recognizing a specific peptide in the context of a given MHC molecule can be explored for common features that might explain their antigen specificity. However, despite the development of numerous experimental and bioinformatic strategies, the specificity problem remains unresolved. To address the need for additional experimental paradigms, we report here on an in vivo experimental strategy designed to artificially diversify a transgenic TCR by CRISPR/Cas9‐mediated mutagenesis of Tcra and Tcrb chain genes. In this system, an initially monoclonal repertoire of known specificity is converted into an oligoclonal pool of TCRs of altered antigen reactivity. Tracking the fate of individual clonotypes during the intrathymic differentiation process illuminates the strong selective pressures that shape the repertoire of naïve T cells. Sequence analyses of the artificially diversified repertoires identify key amino acid residues in the CDR3 regions required for antigen recognition, indicating that artificial diversification of well‐characterized TCR transgene sequences helps to reduce the complexities of learning the rules of antigen recognition.
Keywords: Repertoire, T cells, TCR
Diversification of transgenic TCRs by CRISPR/Cas9‐mediated mutagenesis of Tcra and Tcrb chain genes in vivo converts monoclonal repertoires of known specificity into an oligoclonal pool of TCRs of altered antigen reactivities. This generally applicable approach helps to identify crucial amino acid residues in the CDR3 regions required for antigen recognition.
1. Introduction
Antigen receptors expressed on T cells (TCRs) recognize antigens in the context of MHC molecules. Recent high‐throughput sequencing efforts have generated large databases of sequences of Tcra and Tcrb chains, which encode the characteristic heterodimer of the major lineage of T cells. Often, sequence information for these two chains is obtained individually, although recent studies also provide paired sequence information. Collectively, these studies have revealed an astounding diversity of TCR sequences, particularly with respect to the complementarity determining regions 3 (CDR3) that are formed at the single junction of Va and Ja elements in the TCRα chain, and at the two junctions connecting the Vb and Db, and Db and Jb elements, respectively, in the TCRβ chain. In both instances, combinatorial diversity contributes comparatively little to the overall diversity of assembled chains.
Large libraries of different peptides have been used to identify and isolate antigen‐specific T‐cell clones that increase in numbers during infection, or in response to tumors [1, 2, 3, 4, 5, 6, 7]. In this experimental set‐up, the TCR sequences of cells recognizing a specific peptide in the context of a given MHC molecule are determined and can then be scrutinized for common features that might explain their antigen specificity. Such studies have shown that a given pMHC complex can be recognized by different αβTCR receptors and that a given αβTCR receptor can interact with many different peptides in the pMHC complex. To deal with these intriguing, yet daunting biological features, machine learning algorithms of various kinds are increasingly brought to bear on this problem to generate rules by which one would be able to predict the specificity of any TCR [8, 9, 10, 11, 12, 13]. The same strategies are being used to interrogate other features of αβTCR sequences, such as those associated with CD4 and CD8 lineage choice or self‐reactivity [14].
Apart from a general immunological perspective, there is considerable interest in understanding the rules governing pMHC‐TCR interactions for therapeutic applications, for several clinically relevant immunotherapeutic settings would benefit from such knowledge. For instance, one could imagine that ab initio design of TCRs specific for a mutated self‐peptide might be used to rapidly engineer patient‐specific T cells for tumor therapy. Current databases that can be used to learn the rules of TCR specificity have considerable bias; most pertinent datasets concern TCR repertoires for HLA‐A*02:01 restricted peptides, and little information is afforded on MHCII peptidome‐related TCRs. Even fewer such studies have been conducted in the mouse, often experimentally validating only a few TCRs (for a recent exception relevant to the αβTCR repertoire in the present context, see [15]). Thus, the determination of the antigen specificity of TCRs based on their sequence alone remains challenging, particularly when one considers that the CDR3s of both TCRα and TCRβ chains contribute to MHC and peptide binding.
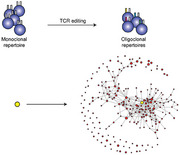
To address the need for additional experimental paradigms conducive to TCR specificity determination, we report here on a novel in vivo experimental strategy. Instead of analyzing a set of polyclonal TCRs selected for a given antigen specificity, we begin with a monoclonal situation, most conveniently achieved with a TCR transgene on a Rag‐deficient background. This strategy eliminates the confounding effects of endogenous Tcra and Tcrb genes and allows one to greatly simplify the computational task. Initiating mutagenesis in CD4/CD8‐double‐negative immature thymocytes using the CRISPR/Cas9 system in vivo allows us to determine (1) the initial (that is, preselection) sequence diversity of the repertoire, (2) the clonotypic changes during intrathymic positive and negative selection, and (3) the composition of the resulting peripheral repertoire of mature T cells. In other words, our strategy is designed to artificially convert an initially monoclonal repertoire of known specificity into an oligoclonal pool of TCRs, presumably of expanded antigen reactivity (Figure 1A), which then undergoes the physiological steps of positive and negative selection in the thymus.
FIGURE 1.
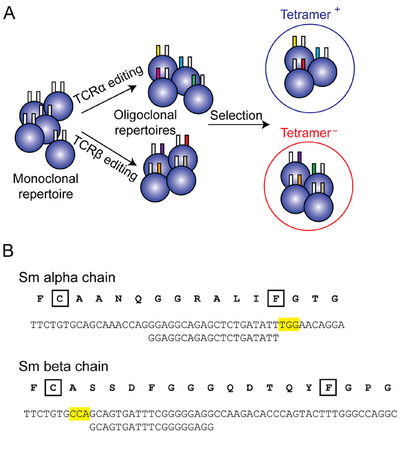
Characterization of the experimental model. (A) Schematic depiction of the overall strategy for diversification of Tcra or Tcrb chains of the Sm TCR. After editing, tetramer staining can be used to categorize the expanded repertoire. (B) Nucleotide sequences of the CDR3 regions of Tcra and Tcrb chains, with sgRNA sequences, indicated in the artwork; the PAM sites are indicated in boldface letters. The protein sequences (in single‐letter code) are shown above the nucleotide sequences. The characteristic cysteine (C) residue at the C‐terminal end of the V region, and the phenylalanine (F) residue of the characteristic FGxG tetrad in the J region are boxed. N‐regions composed of nontemplated nucleotides occur between the Va and Ja elements, and between Vb and Db and Db and Jb elements, respectively.
The great advantage of artificially diversifying the TCR sequence lies in the ability to target different regions in the CDR3 region. Whereas in the natural context, sequence diversification occurs at the junction of V, D, and J elements, the CRISPR/Cas9 system allows one to also change germline‐encoded nucleotides and thereby expand the physiological sequence space. To exemplify these two principal strategies, we chose to target the N‐terminal coding region of the J element in the TCRα chain, and the junction between V and D elements in the TCRβ chain, respectively (Figure 1B). The former case is equivalent to expanding the sequence diversity of the germline‐encoded segments of Ja elements. Typically, a Ja element of mouse encodes between 10 and 13 amino acids of variable sequence between the recombination signal sequence at the 5´ end and the codon for phenylalanine, whereas the C‐terminal amino acid residues of Jα elements are fairly well‐conserved. Thus, the amino acids N‐terminal to the phenylalanine (F) residue contribute most to the antigen specificity conferred by Jα elements and were chosen here as the target of non‐canonical diversification. For diversification of the CDR3 region of the Tcrb, we have chosen to target the 5´ N‐region, that is, the one between Vb and Db elements, mirroring one of the physiological hotspots of sequence variation in natural VDJ recombinations at the Tcrb locus.
For our proof‐of‐principle experiments, we have chosen the SMARTA TCR (Sm), which recognizes an LCMV‐derived peptide (gp66), DIYKGVYQFKSV, in the context of MHC class II (H2‐I‐Ab) [16]. It was selected for two reasons. First, very few studies in the mouse have targeted pMHCII‐associated TCR repertoires; second, the TCR repertoires of H2‐I‐Ab‐restricted T cells that clonally expand during LCMV infection have been described [15], enabling a comparison of the in vivo artificially diversified peptide‐reactive repertoire to a physiologically selected repertoire of TCRs.
Our results show that CRISPR/Cas9‐mediated diversification yields biologically meaningful variants and that these variations likely result in altered antigen specificities.
2. Results
2.1. Characterization of the Target TCR
Expression of the SMARTA TCR transgene (Sm) skews the physiological CD4/CD8 ratio during thymocyte development toward the CD4 lineage [16]. Whereas in nontransgenic mice CD4 cells outnumber CD8 cells by a factor of two, the presence of the Sm transgene favors CD4 cell development to arrive at a ratio of approximately 7:1, indicating that the Sm TCR is positively selected by an (unknown) endogenous intrathymic ligand. In the Rag2‐deficient background, wherein the Sm transgene rescues failing thymocyte development, the CD4/CD8 ratio increases even more (Figure S1). In the peripheral T‐cell compartment of Sm+ Rag2 −/− mice, the distortion of the CD4/CD8 ratio is exacerbated; CD4 single‐positive cells represent close to 80% of splenocytes, whereas only a small fraction is CD8 single‐positive cells (Figure S1). No Foxp3‐positive cells are detectable in Sm+ Rag2 −/− mice [17] (Figure S2). The expression of the Sm transgene begins at the DN stage, and continues throughout thymic T‐cell development (Figure S3); within the DN compartment, expression is robustly detectable at the DN3 and DN4 stages (Figure S4). The surface expression of the Sm TCR can be followed by antibodies specific for its Vα2 and Vβ8.3 variable regions or, alternatively, by a Sm‐specific tetramer (Figure S5).
2.2. The Experimental System for Artificial Diversification
Artificial diversification of CDR3 sequences requires four transgenes. The sgRNA sequences corresponding to the chosen target sites in the CDR3 regions of the Sm Tcr genes (Figure 1B) were incorporated into a ubiquitous expression system using the human U6 promotor (hU6:sgRNA CDR3a and hU6:sgRNA CDR3b), respectively (see Methods). They were each combined with a further three components: (1) the Sm transgene [16] itself; (2) a conditional Cas9 expression construct (Rosa26:LSL‐Cas9‐YFP) inserted into the ubiquitously transcribed Rosa26 locus [18]; and (3) a pLck:Cre expression construct [19]. In such quadruple transgenic mice, the proximal Lck promotor (pLck) becomes active in DN2/DN3 thymocytes to produce Cre recombinase; the recombinase then removes the stop cassette in the Rosa26 locus, which initiates Cas9 gene expression; the Cas9 protein forms a specific RNP complex with the ubiquitously expressed sgRNA that attacks the CDR3 region of the cognate TCR chain of Sm gene. The ends of the ensuing double‐strand breaks (DSBs) are joined together by the error‐prone nonhomologous end joining (NHEJ) repair process leading to the formation of variant CDR3 sequences (Figure 2A,B). This pool of CDR3 sequences then enters the T‐cell differentiation process in vivo. Where desired, we removed the contributions of the endogenous TCR assembly process by adding Rag2‐deficiency as the fifth transgenic component to the compound genotypes.
FIGURE 2.
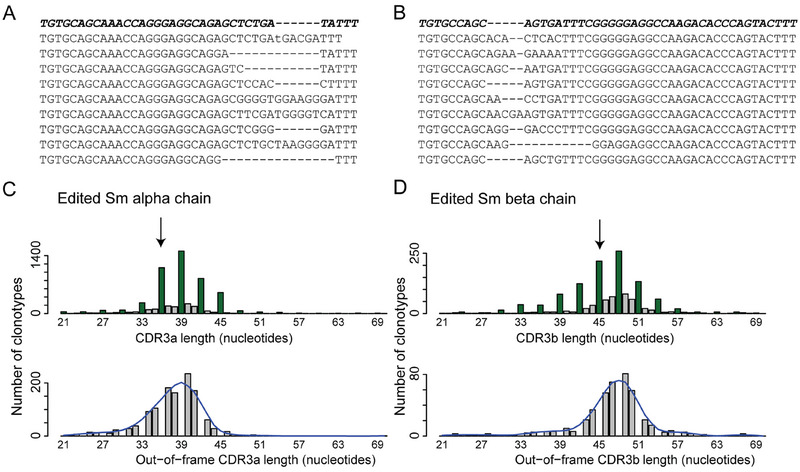
Artificial diversification of Sm Tcra and Tcrb chains. (A) Alignment of a random selection of edited Tcra sequences; the original unedited Tcra sequence is shown in the top row (boldface letters). The genotype of mice is Sm+; pLck:Cre; hU6:sgRNA CDR3a; Rosa26:LSL‐Cas9‐YFP; Rag2 –/–. (B) Alignment of a random selection of edited TCRb sequences; the original unedited Tcrb sequence is shown in the top row (boldface letters). The genotype of mice is Sm+; pLck:Cre; hU6:sgRNA CDR3b; Rosa26:LSL‐Cas9‐YFP; Rag2 –/–. (C) Size distribution of edited CDR3 Tcra regions; the length of the original Sm Tcra chain is marked by an arrow (top panel). An enlarged view of the size distribution without potentially functional in‐frame sequences is shown in the bottom panel (a smoothed distribution curve is overlayed). The analysis is based on a total of 4769 clonotypes (represented by 87,944 mRNA molecules) pooled from n = 6 mice. (D) Size distribution of edited CDR3 Tcrb regions; the length of the original Sm Tcrb chain is marked by an arrow (top panel). Presentation of data analogous to (C). The analysis is based on a total of 1291 clonotypes (represented by 260,239 mRNA molecules) pooled from n = 14 mice.
2.3. Flow Cytometric Analysis of Edited Repertoires
The compositions of the artificially diversified repertoires can be assessed by use of the gp66 I‐Ab tetramer (henceforth abbreviated as tetramer). The original Sm TCR (and possibly minor variants) will bind to the tetramer, whereas more extensively modified sequences may fail to interact with the tetramer; for instance, in the example shown in Figure S5 for the case of Tcra editing, the DN population contains a large fraction of tetramer‐positive cells that also express the Sm transgenic Vα2 and Vβ8.3 chains, as expected. By contrast, the CD4 single‐positive population contains hardly any tetramer‐positive cells; nonetheless, the Vβ8.3 chain is still expressed, because, in the Rag2‐sufficient background, it can pair with endogenous TCRα chains to form a receptor at the cell surface. Collectively, this outcome is a strong indication of efficient editing. When the same analysis is conducted after Tcrb editing, we noted that the shift in the tetramer‐binding profile was relatively small, indicating that the successful completion of the maturation of CD4 single‐positive thymocytes is very sensitive to sequence changes in the TCRβ chain (Figure S5).
2.4. Sequence Diversity of Oligoclonal Tcra and Tcrb Repertoires
The CRISPR/Cas9‐edited CDR3 sequences of Tcra and Tcrb share several characteristics. Although some edited versions are shorter than the original CDR3 sequence, most edited sequences are longer. However, this is not the result of the intrathymic selection process, as is evident from the superimposable size distributions of out‐of‐frame sequences (which can be considered to be representative of the pre‐selection repertoire) that also show the shift in the length distribution (Figure 2). Note that in our system, the editing process occurs at the DN3 stage, during which endogenous Tcrb genes would be assembled to enable the formation of the preTCR complex. Hence, at least some nontemplated nucleotides occurring in the modified CDR3 regions may be the result of the activity of terminal deoxynucleotidyl transferase at this developmental stage, in addition to the changes afforded by the error‐prone NHEJ process. The number of detectable clonotypes after CRISPR/Cas9‐mediated editing is several‐fold higher for Tcra than for Tcrb (Figure 2C,D). This is not due to differences in sequence coverage, as the average number of mRNA molecules per clonotype is ∼18 for Tcra and ∼200 for Tcrb. We interpret this result to mean that alterations of the sequence of the Tcrb gene in the Rag2‐deficient background more often impair positive selection than those affecting the Tcra gene.
2.5. Intrathymic Selection of Edited TCR Sequences
The present strategy lends itself to a detailed analysis of the step‐wise selection process in the thymus. Compared with the unedited Sm TCR, editing of Tcra on the Rag2‐deficient background led to large numbers of CD4/CD8 double‐positive (DP) thymocytes, accompanied by only a few DN and single‐positive cells (Figure 3A,B). This profile is compatible with a differentiation block at the DP stage. Indeed, among cells expressing the TCR complex at the surface, the majority have a DN‐stage phenotype, whereas only a few DP thymocytes express the receptor at the surface (Figure 3C,D). This flow cytometric phenotype suggests the presence of an efficient editing process, as a result of which only a few productive Tcra sequences remain that can support selection into the CD4 single‐positive pool.
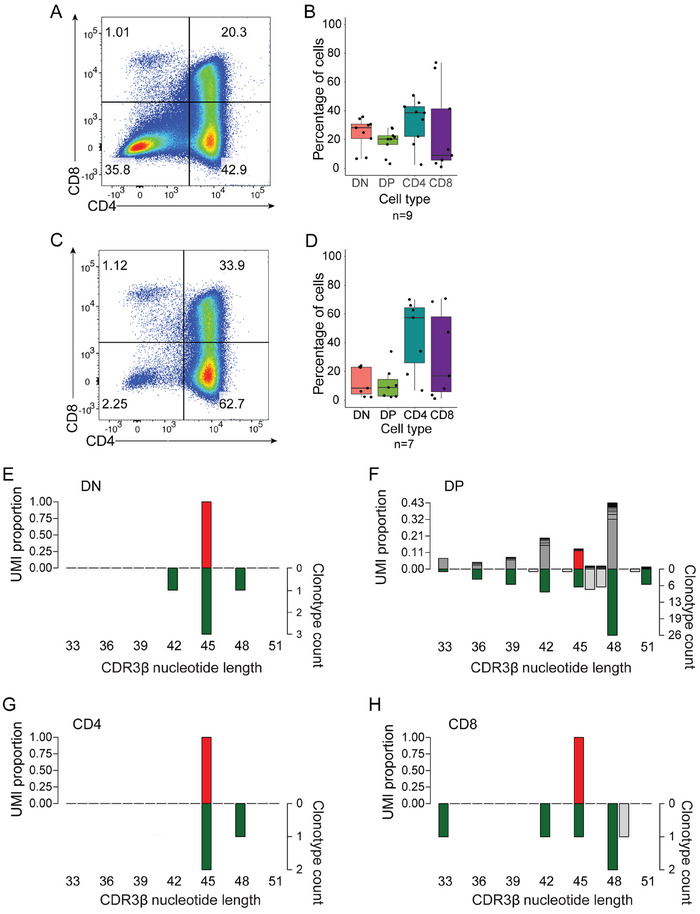
FIGURE 3.
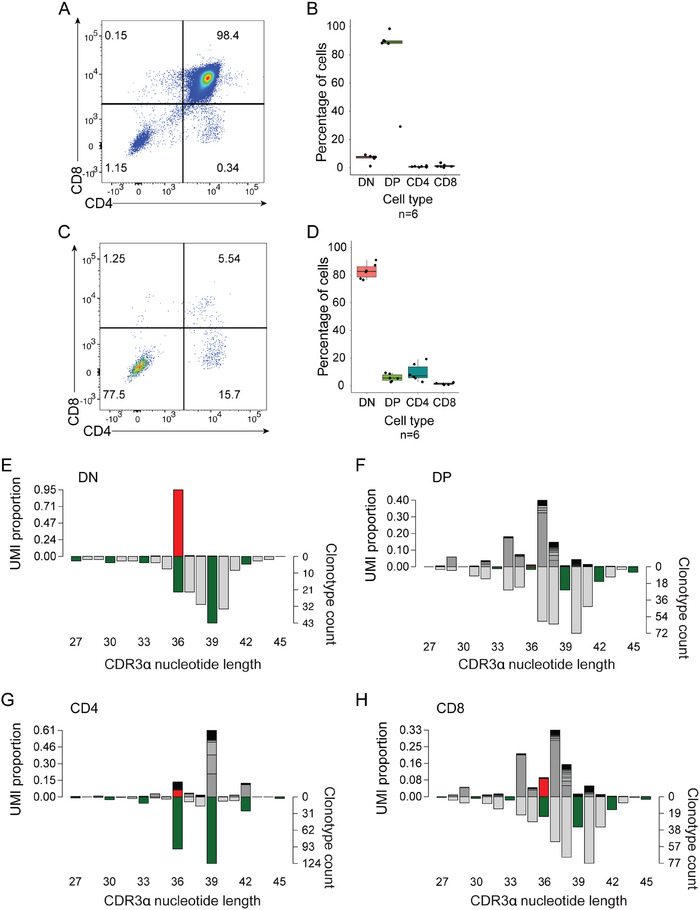
Repertoire selection after Tcra editing. (A) Distribution of total thymocyte CD4 and CD8 populations. A flow cytometric profile is shown for illustrative purposes. (B) The results of experiments in (A) are summarized in the right panel (n = 6). (C) Distribution of surface TCRb+ CD4 and CD8 thymocyte populations. A flow cytometric profile is shown for illustrative purposes. (D) The results of experiments in (C) are summarized in the right panel (n = 6). (E) Sequence variants present in DN thymocyte populations; data are from n = 8 mice. (F) Sequence variants present in DP thymocytes. (G) Sequence variants present in CD4‐SP thymocytes; data are from n = 1 mouse. (H) Sequence variants present in CD8‐SP thymocytes; data are from n = 1 mouse. In (E)–(H), UMI‐weighted representations of clonotypes (left y‐axis) and a number of total sequence variants (right y‐axis) are plotted as a function of CDR3 length; the unedited Sm Tcra sequence is indicated in red, in‐frame variants are highlighted in green.
In order to confirm this conclusion, we carried out a detailed analysis of CDR3 sequences after Tcra editing, considering two aspects. First, we determined the number of Tcr mRNA molecules, represented as the number of unique molecular identifiers that are introduced during the cDNA synthesis. When a particular mRNA sequence is represented by many UMIs, we assume that the number of cells in the relevant cell population that express this particular sequence (clonotype) is high. The number of molecules per clonotype are then plotted as a function of CDR3 lengths. Second, we consider the overall number of different CDR3 sequences (that is, clonotypes) to give an indication of the overall sequence diversity. These histograms therefore provide information about the population structure, which, in general, is characterized by the presence of a few large clones amidst many small ones.
At the DN stage, almost all transcripts emanate from the original unedited Tcra (red bar in Figure 3E); however, the presence of the many clonotypes in the population indicates that editing has occurred (Figure 3E). In the DP population, the overwhelming majority (97.8%) of expressed clonotypes are out‐of‐frame sequences (Figure 3F), explaining the paucity of DP thymocytes expressing a TCR at the surface (Figure 3C,D). By contrast, expressed clonotypes in the CD4 single‐positive population almost exclusively (92.3%) comprise in‐frame Tcra sequences, of which only a small proportion represents the original sequence (Figure 3G), indicating that variant sequences survive the intra‐thymic selection process. Owing to the composition of clonotypes in the CD8‐positive compartment, which appears to be very similar to that of the DP compartment, we propose that they for the most part represent immature single progenitor CD8s, rather than mature CD8 cells (Figure 3H).
The situation is different for the Tcrb editing process. In this case, a large population of CD4 single‐positive cells remains, accompanied by an even larger DN population; of note, the outcome of editing (Figure 4A,B) with respect to the four major thymocyte populations is much more variable than what was observed for Tcra editing (Figure 3). In contrast to the case of Tcra editing (Figure 3), Tcrb surface expression is most prominent in the DP and CD4 SP populations (Figure 4C,D). This phenotype is reflected in the distribution of clonotypes (Figure 4E–H), where the unedited version and other in‐frame variants predominate for both DP (83.4%) and CD4 SP (86.4%) cells.
FIGURE 4.
Repertoire selection after Tcrb editing. (A) Distribution of total thymocyte CD4 and CD8 populations. A flow cytometric profile is shown for illustrative purposes. (B) The results of experiments in (A) are summarized in the right panel (n = 9). (C) Distribution of surface TCRb+ CD4 and CD8 thymocyte populations. A flow cytometric profile is shown for illustrative purposes. (D) The results of experiments in (C) are summarized in the right panel (n = 7). (E) Sequence variants present in DN thymocyte populations; data are from n = 2 mice. (F) Sequence variants present in DP thymocytes; data are from n = 2 mice. (G) Sequence variants present in CD4‐SP thymocytes; data are from n = 2 mice. (H) Sequence variants present in CD8‐SP thymocytes; data are from n = 2 mice. In (E)‐(H), UMI‐weighted representations of clonotypes (left y‐axis) and number of total sequence variants (right y‐axis) are plotted as a function of CDR3 length; the unedited Sm Tcrb sequence is indicated in red, in‐frame variants are highlighted in green.
In summary, the distribution of clonotypes in the different thymocyte populations illustrates the selective forces that are imposed on developing thymocytes when they undergo positive and negative selection. The depletion of out‐of‐frame sequences at the transition from DP to SP cells is particularly striking. The specific constellation of the Tcra and Tcrb gene sequences encoding the Sm TCR likely determines the relative importance of the two chains for positive selection of T cells that is mirrored in the different outcomes of Tcra and Tcrb editing; the degree of sequence malleability in the TCRα chain is much higher than that for the TCRβ chain.
2.6. Loss of gp66‐77 Antigen Recognition in Edited TCR Populations
We then turned to the analysis of the peripheral T‐cell compartment, with particular emphasis on the antigen specificity of the artificially diversified T‐cell repertoire. As expected from the outcome of intra‐thymic development, Tcra editing causes a greater loss of tetramer‐binding cells than Tcrb editing; whereas 43.1% (range 12.8% to 80%) of CD4+ splenocytes bound the tetramer after Tcra editing, 89.3% (range 63.4% to 99%) did so in Tcrb edited mice (Figure 5A,B). When we analyzed the sequences in tetramer‐positive and tetramer‐negative cells, several features emerged. In Tcra‐edited mice, most CDR3 regions of splenic CD4+Vα2+Vβ8.3+tetramer+ cells have the same length as the original sequence or contain just one additional amino acid (Figure 5C). By contrast, almost all clonotypes found in tetramer‐negative cells have longer CDR3 regions (Figure 5D) and exhibit a broader size distribution. Of note, the frequencies with which individual clonotypes are represented in the population vary considerably (as measured by the number of UMIs associated with a given clonotype); a few clones dominate the repertoire. In the case of Tcrb‐edited mice, fewer clonotypes are present in the peripheral T‐cell compartment (Figure 5E,F), in line with the characteristics observed for thymocytes (Figure 4). Noncognate clonotypes, although clearly present in the population (Figure 5E), contribute only very little to the tetramer‐positive fraction; the original Tcrb sequence dominates and comprises 95.8% of the expressed clonotypes (Figure 5E). The size distribution of tetramer‐negative cells is again broader than that of their positive counterparts; the expression profile indicates that about 80% of clonotypes contain variant sequences (Figure 5F); owing to the very few tetramer‐negative cells in the population, it proved difficult to reliably purify them away from tetramer‐positive cells, as is evident from an approximately 15%–20% proportion of the unedited Tcrb chain.
FIGURE 5.
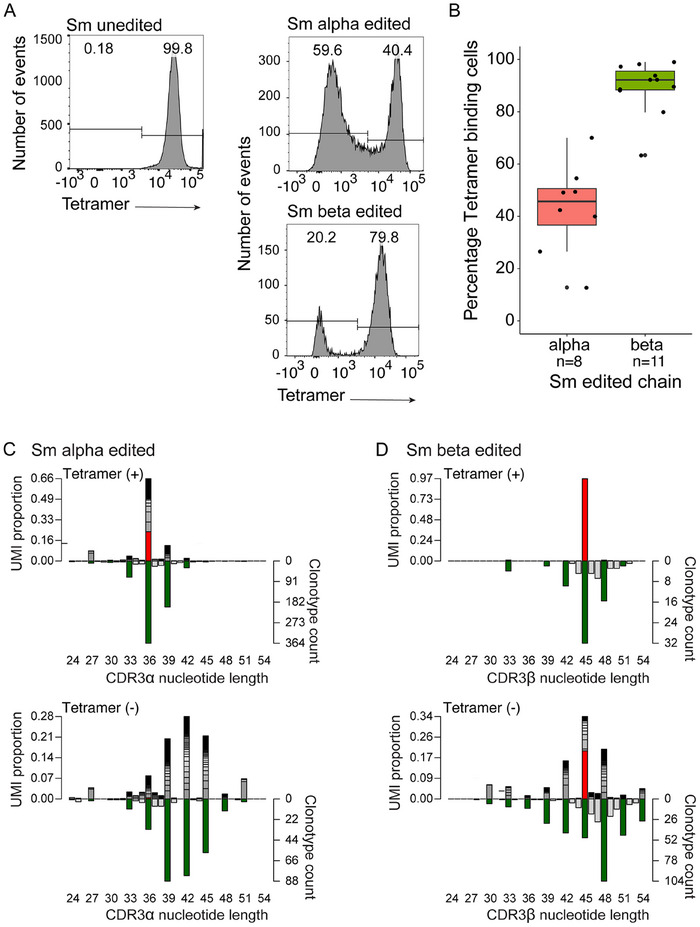
Peripheral T‐cell populations after Tcra and Tcrb editing. (A) Representative flow cytometric patterns of CD4+Vα2+Vβ8.3+ splenocytes of mice with the indicated genotypes using a gp66‐specific tetramer. (B) Percentage of tetramer‐positive cells among CD4+Vα2+Vβ8.3+ splenocytes of Tcra‐edited (n = 8) and Tcrb‐edited (n = 11) mice. (C, D) Sequence variants generated in Tcra‐edited mice stratified into tetramer‐positive (C) and tetramer‐negative (D) cells. (E, F); data are from n = 3 mice. Sequence variants generated in Tcrb‐edited mice stratified into tetramer‐positive (E) and tetramer‐negative (F) cells; data are from n = 8 mice.
2.7. Sequence Space of Antigen Reactive TCRs
Next, we studied the sequence diversity among peripheral T cells. We reasoned that the network properties with respect to sequence similarity would provide information on how flexible TCRα and TCRβ sequences are in their contribution to the binding of the tetramer. Whereas our clonotype assessment in Figures 2, 3, 4, 5 was based on nucleotide sequences, here we consider the derived amino acid sequences of the CDR3 regions. In the network graphs shown in Figures 6 and 7, each node represents a unique TCR sequence, the size of the circle being proportional (at a logarithmic scale) to the UMI count in the population; pairs of nodes were then connected by an edge, when they were separated by one amino acid difference [Levenshtein distance of 1], that is, by replacement, deletion, or addition of one amino acid. The unedited sequence is indicated by a yellow node. For the network of amino acid variants generated for TCRα (Figure 6A), we find that a variant of the unedited CDR3 sequence (CAANQGGRALGF; G instead of I) is the most connected node with 30 edges. The average degree of connectivity of the network, that is, the average number of edges connected to a node is 4.04. Although many sequences differ from the original sequence by only one amino acid, a substantial fraction differs by two and three residues; in addition, tetramer‐negative clonotypes tend to diverge more from the original sequence (Figure 6B). This is reflected in an almost three‐fold difference in the degrees of connectivity, 7.2 edges in the tetramer‐positive population versus 2.8 edges in the tetramer‐negative population (Figure 6). The amino acid compositions in tetramer‐positive and tetramer‐negative cells also differ; of note, the presence of isoleucine directly N‐terminal to the phenylalanine residue of the characteristic FGXG tetrad of the Jα region appears to strongly disfavor tetramer binding (Figure 6C).
FIGURE 6.
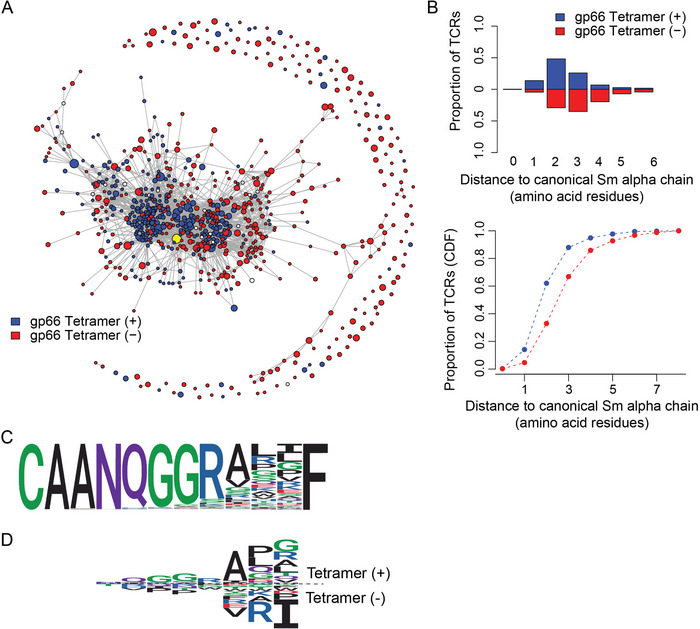
Analysis of clonotypic networks in Tcra‐edited peripheral CD4+ T cells. (A) Network depiction of amino acid CDR3 diversity, for Tcra‐edited mice (n = 3). Sequences (nodes) that differ by a single amino acid from one another are connected by an edge. Node size is depicted on a logarithmic scale proportional to the UMI count. Blue nodes represent sequences from tetramer‐positive, and red nodes represent sequences from tetramer‐negative populations. The original sequence is indicated as a yellow node. (B) Cumulative frequency of sequences as a function of the distance to unedited Tcra sequence. The blue curve represents sequences from tetramer‐positive, and the red curve represents sequences from tetramer‐negative populations. (C) Logo plots for all CDR3 sequences of length 12 amino acid residues. (D) Comparative logo plots for CDR3 sequences of length 12 amino acid residues from tetramer‐positive cells (top panel) and sequences from tetramer‐negative populations (bottom panel).
FIGURE 7.
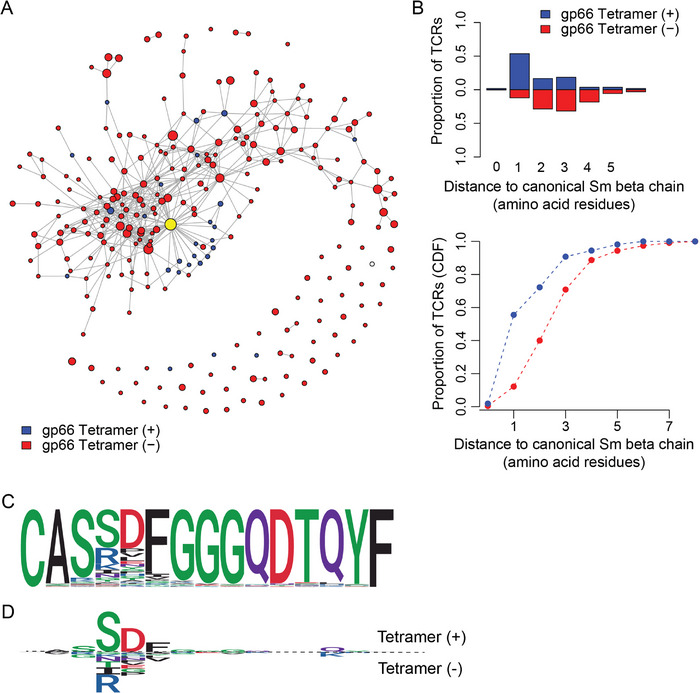
Analysis of clonotypic networks in Tcrb‐edited peripheral CD4+ T cells. (A) Network depiction of amino acid CDR3 diversity, for Tcrb‐edited mice (n = 8). Sequences (nodes) that differ by a single amino acid from one another are connected by an edge. Node size is depicted on a logarithmic scale proportional to the UMI count. Blue nodes represent sequences from tetramer‐positive, and red nodes represent sequences from tetramer‐negative populations. The original sequence is indicated as a yellow node. (B) Cumulative frequency of sequences as a function of the distance to unedited Tcrb sequence. The blue curve represents sequences from tetramer‐positive, and the red curve represents sequences from tetramer‐negative populations. (C) Logo plots for all CDR3 sequences of length 12 amino acid residues. (D) Comparative logo plots for CDR3 sequences of length 12 amino acid residues from tetramer‐positive cells (top panel) and sequences from tetramer‐negative populations (bottom panel).
Among TCRβ sequences recovered from the tetramer‐negative fraction, the divergence from the original sequence is even more pronounced (Figure 7A); most tetramer‐negative clonotypes carry three variant amino acids, whereas their tetramer‐positive counterparts diverge by only one residue (Figure 7B). The average degree of connectivity of the TCR‐β repertoire (4.35 edges per node) is slightly higher than that for the edited TCR‐α repertoire. Whereas the original sequence is the most connected one (42 edges), the nodes of tetramer‐binding cells are slightly less connected than the average (3.8 nodes) and mostly connect to the central (unedited) node (Figure S6). As a consequence, most TCRβ sequences in the tetramer‐positive population are at an editing distance of 1 of the canonical Sm sequence (Figure 7B). As with TCRα sequences, it appears that certain amino acids are incompatible with tetramer‐binding. In the case of TCRβ clonotypes, those in tetramer‐positive cells almost invariable carry a serine residue at C‐terminal position +3 relative to the characteristic cysteine residue of the Vβ region, whereas tetramer‐negative cells possess bulkier (and sometimes even charged) residues at this position; a similar difference is observed at position +4, where tetramer‐positive cells exhibit an almost invariant aspartate (Figure 7C). We conclude that TCRα variants from tetramer‐binding cells form a well‐connected subgraph, whereas changes in the TCRβ sequences are less well tolerated with respect to tetramer binding.
2.8. New Antigenic Specificities of Edited TCRs
As indicated above, the use of tetramers revealed the relative contributions of TCRα and TCRβ chains to the recognition of the cognate gp66‐77 antigen and the effects of sequence changes in the CDR3 regions on antigen binding. We, therefore, examined whether the edited receptor repertoire harbors altered specificities, that is, reactivities against (unknown) endogenous self‐antigens distinct from those that support positive selection of the cognate Sm receptor. To do this, we examined the emergence of regulatory T cells in the peripheral compartment, which we considered a sensitive test because hardly any Foxp3‐positive cells are detectable among the cells expressing the Sm transgene [17] (Figure S2), in stark contrast to the Sm‐negative cells (Figure 8A,B). When Tcra editing occurs in Rag2‐sufficient mice, the imbalance between the transgenic TCR chains causes the transgenic TCRα chain to be replaced by endogenous TCRα chains; accordingly, in the example shown in Figure 8C, only a small fraction of Vβ8.3‐positive cells also express the transgenic Vα2 chain. The reduction of cognate Sm‐positive cells is associated with the appearance of a small but noticeable population Foxp3‐positive cells in the Vα2/Vβ8.3 double‐positive transgenic population (2.6%; 3.1% [n = 2]); however, essentially all Foxp3‐positive cells (88.3%; 92.0% [n = 2]) belong to the tetramer‐negative fraction (Figure 8C), suggesting that they recognize noncognate self‐antigens. This effect is magnified in the Rag2‐deficient background, where no endogenous TCRα chains [20] can replace the altered TCRα component. Among the Vα2/Vβ8.3 double‐positive population, about 20% are also positive for Foxp3 (20.5%), and, again, all of these cells belong to the tetramer‐negative fraction (95.2%) (Figure 8D). Collectively, these data show that sequence alterations in the transgenic TCRα chain not only cause the loss of binding to the cognate antigen but may also generate antigen specificities for a new set of self‐antigens, the identity of which is currently unknown.
FIGURE 8.
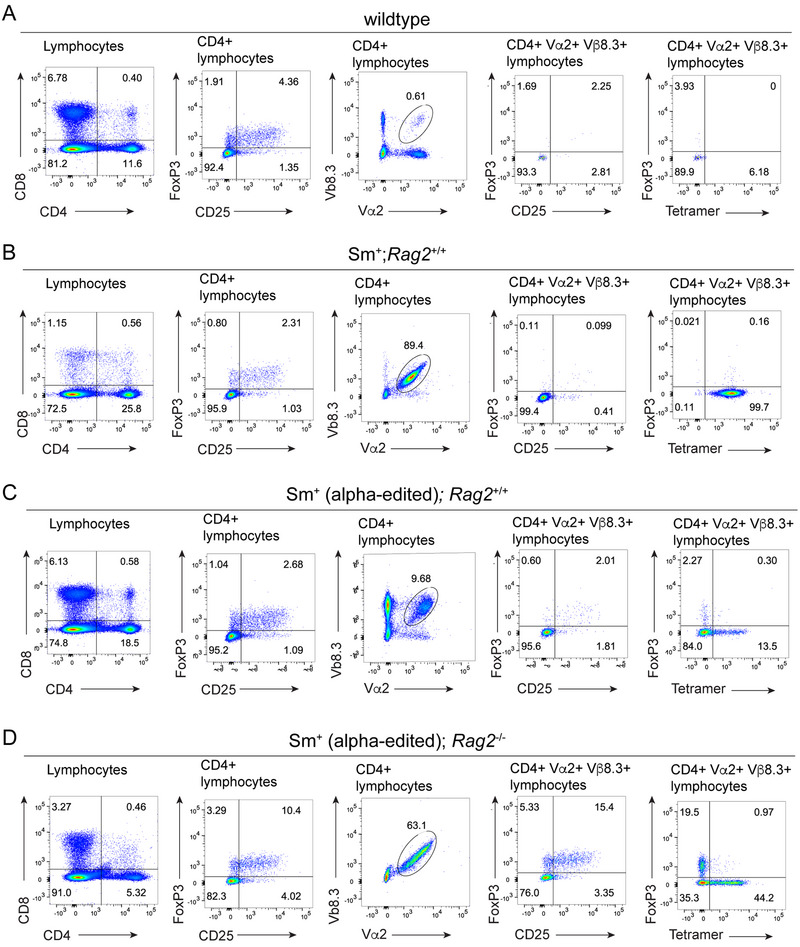
Tcra editing generates novel antigen specificities of peripheral CD4+ T cells. (A) Flow cytometric analysis of CD4+ splenocytes according to the indicated parameters in wild‐type mice; representative of n = 2 mice. (B) Analysis of Rag2‐sufficient Sm transgenic mice; representative of n = 2 mice. (C) Analysis of a Tcra‐edited Rag2‐sufficient Sm transgenic mouse. (D) Analysis of a Tcra‐edited Rag2‐deficient Sm transgenic mouse. For all panels, the gates are indicated at the top.
2.9. Noncanonical Diversification of CDR3 Regions
A particular advantage of the strategy outlined here is its versatility with respect to the region of sequence diversification. Whereas the physiological RAG‐mediated assembly of antigen receptor genes reflects the combined effects of error‐prone nonhomologous end joining coupled to the activity of terminal deoxynucleotidyl transferase at the free ends of V (D) and J elements, artificial diversification can, in principle, target any aspect of the CDR3 regions, not just the junctional sequences. By way of example, we compare the nucleotide sequences of an arbitrary length of CDR3 regions (45 nucleotides) derived from a polyclonal repertoire of Va2‐Vb8.3 assemblies [21] and those of the artificially diversified population. In the wild‐type sequences, the high sequence diversity of the Va‐Ja junction in the CDR3 region is immediately apparent (Figure 9A, top row). By contrast, because the site of diversification is shifted to the right in the artificial diversification process, the greatest sequence diversity occurs just upstream of the TTT codon encoding the characteristic phenylalanine residue of the FGXG tetrad of Ja elements (Figure 9A, bottom row). These regional differences are best appreciated in the diagram plotting the values for the conditional information of the diversified segments (Figure 9B). Interestingly, the novel Ja sequence variants generated by artificial diversification have virtually no correspondence to the natural mouse germ‐line sequences. Among the 64 Jα sequences that are used in the mouse immune system, 28 different XXXF sequences (X indicates any amino acid residue; F here is the first residue of the FGXG tetrad) are represented. When these germline‐encoded sequences are compared to the 53 most frequently used Jα sequences in the collection of artificially diversified segments, they each form a separate network without overlap. Yet, despite these distinct sequence repertoires, the artificially diversified Jα sequences can be equally well selected into the functional peripheral T‐cell pool, with some exhibiting the same antigen specificity as the original Sm chain. This is a testament to the strong selection of TCRs during T‐cell development and may explain why Jα sequences exhibit little conservation across species [21].
FIGURE 9.
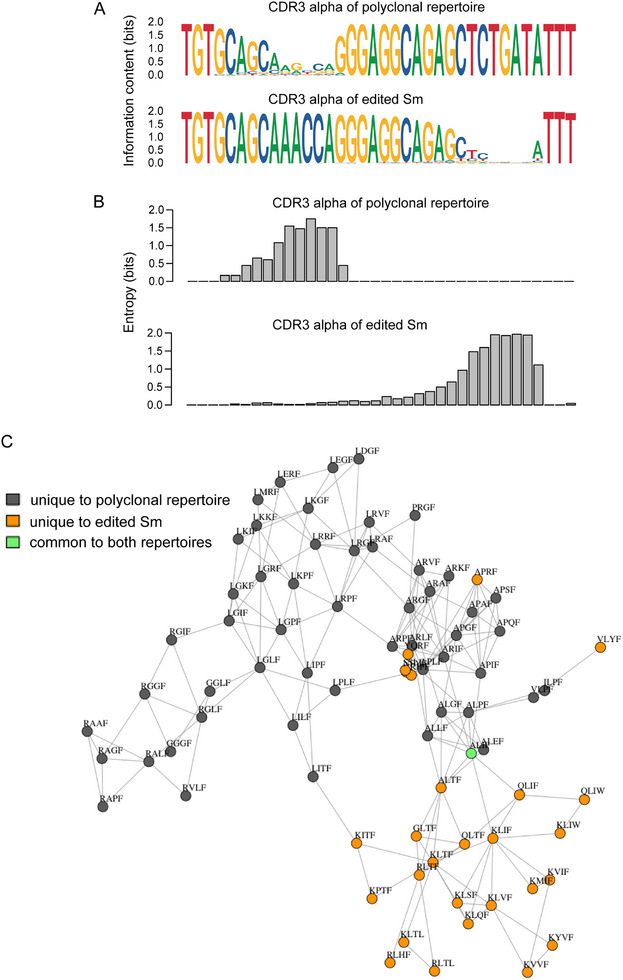
Comparison of naturally and artificially diversified Tcra repertoires. (A) Nucleotide sequence composition of CDR3 regions of polyclonal wildtype Tcra assemblies derived from Va2 and Vb8.3 rearrangements (top sequence) and edited CDR3 sequences of the Sm Tcra chain gene. (B) Conditional information of sequence collections is depicted in (A). (C) Network depiction of germline‐encoded Jα sequences (XXXF; F representing the first amino acid residue of the characteristic FGXG tetrad of Ja sequences) with those found in tetramer‐positive cells of Tcra‐edited mice.
In a final comparison, we attempted to match our collection of artificially edited TCR sequences that are expressed by tetramer‐positive cells to the TCR repertoire that emerged in mice after LCMV infection or immunization with the immunodominant gp epitope [15]. No overlap was found between the 473 unique Tcra sequences identified in the LCMV cohort and our CRISPR/Cas9‐mutated Tcra sequences; however, 359 of LCMV expanded clones [15] overlap with the 131,009 TCRa CDR3 sequences [21] of wildtype mice, equivalent to 0.27% of the sequence space.
3. Conclusion
The structural features of antigen receptor repertoires are at the center of much current immunological research, with a particular focus on deciphering their antigen specificities. Indeed, the use of T cells for therapeutic purposes would benefit greatly from the ability to predict the antigen‐specificity of any TCR sequence, or, vice versa, to ab initio predict a reactive TCR sequence for any given peptide‐MHC complex. The combination of high‐throughput sequencing and computational analyses has led to several notable advances toward these goals. Progress, however, is hampered by the astronomical complexity of the TCR repertoire and the equally diverse universe of potential MHC peptide ligands. Our work addresses the problem of deciphering antigen‐specificity from a different angle. We start from a TCR of a known specificity and employ an artificial in vivo system of sequence diversification of the CDR3 regions to monitor the effect on intra‐thymic selection and antigen reactivity. The comparative analysis of natural and artificially diversified Tcra sequences described here indicates that the combination of structural flexibility of TCRs and the strong selective forces operating in the immune system are sufficient to elaborate physiologically meaningful TCR repertoires even from unusual Ja gene sequences. On the one hand, this feature may seem to add a further level of (undesired) complication in the quest to understand the rules of TCR‐pMHC interactions; however, on the other hand, it offers unexpected flexibility for engineering antigen‐specific TCRs. Nonetheless, given the availability of dozens of well‐characterized TCR transgenes, we posit that, compared to the analysis of a naturally arising repertoire, our approach reduces the complexities associated with learning the rules of antigen recognition. We thus consider our new experimental paradigm as a complement to current efforts aimed at learning the rules governing the relationship of TCR sequences and recognition of specific peptide/MHC complexes.
3.1. Data Limitations and Perspectives
The present work introduces a new experimental paradigm aimed at understanding the rules that determine the specificity of pMHC/TCR interactions that can be generalized to the study of other known pMHC/TCR complexes, ideally, those for which structural information is available for the cognate ligand/receptor pairs. The results of our proof‐of‐concept experiment indicate that it is possible to artificially diversify a monoclonal TCR in vivo, to follow the intra‐thymic selection events, to analyze the antigen‐binding properties of the peripheral T‐cell pool, and to associate sequence changes in the CDR3 region to the retention or loss of reactivity toward one specific antigen. Although the emergence of Foxp3‐positive T cells in the diversified T‐cell pool is indicative of positive selection by distinct (self) antigens, formal proof of altered peptide specificity requires the identification of the selecting ligand(s). Unfortunately, no structural information on the pMHC/TCR complex that is studied here is available; however, we envisage that the analysis of CDR3 sequences expressed in single cells will likely provide indications of epistatic constraints in the CDR3 sequence that dictate productive interactions with the cognate ligand.
4. Methods
4.1. Mouse Lines
The hU6:sgRNA Tcra and hU6:sgRNA Tcrb transgenes were cloned as NotI fragments into the Bluescript vector and consist of the human U6 promotor (nucleotides 1–264 in Genbank accession number JN255693), followed by the mouse Tcra and Tcrb target sequences (5´‐GAGGCAGAGCTCTGATATT‐3´; 5´‐GCAGTGATTTCGGGGGAGG‐3´), and the sgRNA backbone (nucleotides 218–139 [reverse complement] in Addgene plasmid #42250), followed by a short 3´‐sequence (T6G2A2); for injection into fertilized eggs, the construct was linearized with SacI. Transgenic mice were generated on an FVB/N background (FVB/N‐tg(hU6‐sgRNA‐Tcra)1Tbo/Mpie; FVB/N‐tg(hU6‐sgRNA‐Tcrb)1Tbo/Mpie) and subsequently backcrossed to the C57BL/6J background. Genotyping was performed using primers OBG132 (5´‐GCCTATTTCCCATGATTCCTTC) and OBG133 (5´‐TTCAAGTTGATAACGGACTAGCC); amplicon size 396 bp.
The pLckCre transgenic line was obtained from the Jackson laboratories (B6.Cg‐Tg(Lck‐cre)548Jxm/J; stock no. 003802) [19]. Under this promoter, the onset of expression of Lck is at the DN2 stage of thymocyte development [22]. Genotyping was performed using primers KL003 (5´‐GGTGAACGTGCAAAACAGGCTCTA) and KL004 (5´‐TGCATGATCTCCGGTATTGAAAC); amplicon size 551 bp.
The SMARTA TCR transgenic line, obtained from Hanspeter Pircher, was constructed from TCR sequences derived from a CD4+ clone specific for the LCMV GP‐derived I‐Ab binding epitope (aa 61–80); it is composed of Va2.3 and Vb8.3 TCR variable genes [16]. The transgene is precociously expressed already during the DN stages of thymocyte development [23, 24, 25, 26]. Genotyping [for the Tcrb chain gene] was performed using primers MK14 (5´‐TAACACGAGGAGCCGAGTGCCT) and MK140 (5´‐CTGAGGCTGATCCATTACTC); amplicon size 220 bp.
The Cas9 expression construct consists of a Cas9 transgene expression cassette (3×FLAG‐tagged Streptococcus pyogenes Cas9 linked via a self‐cleaving P2A peptide to an enhanced green fluorescent protein [EGFP]) inserted into the Rosa26 locus; the transgene is driven by the ubiquitous CAG promoter and is interrupted by a loxP‐stop (3×polyA signal)‐loxP (LSL) cassette to render Cas9 expression inducible by the Cre recombinase [18]. Genotyping was performed using primers JBS532 (5´‐CCACGACGGAGACTACAAGG) and JBS533 (5´‐GGGCTCCGATCAGGTTCTTC); amplicon size 254 bp.
The Rag2‐deficient strain (B6.129S6(Cg)‐Rag2tm1Fwa/FwaOrl) [20] was obtained from the EMMA repository (infrafrontier.eu/emma). Genotyping was performed using primers PR114 (5´‐CTTGCCAGGAGGAATCTCTG) and PR116 (5´‐CTCCTGGTATGCCAAGGAAAA) for the wildtype allele (amplicon size 246 bp); and PR120 (5´‐CGTGCAATCATCTTGTTCA) and PR116 (5´‐CTCCTGGTATGCCAAGGAAAA) for the mutant allele (amplicon size 451 bp).
For genotyping, the following PCR conditions were used for all assays: Initial denaturation at 94°C for 2 min, followed by 34 cycles of 94°C for 30 s, 60°C for 30 s, and 72°C for 30 s, and finally an extension step at 72°C for 5 min. DreamTaq DNA Polymerase (Thermo Fisher; catalog number EP0705) was used according to the manufacturer's recommendations.
Mice were kept in the animal facility of the Max Planck Institute of Immunobiology and Epigenetics under specific pathogen‐free conditions. 4‐week‐old mice were used.
4.2. Flow Cytometry
Single‐cell suspensions of thymus and spleen lymphocytes were phenotyped by flow cytometry. Erythrocytes from splenic samples were lysed with ACK lysis buffer (0.15 M NH4Cl, 10 mM KHCO3, 0.1 mM EDTA in H2O, pH 7.2–7.4). Tetramer staining with I‐Ab DIYKGVYQFKSV‐PE‐Tetramer (dilution 1:200) was done before antibody staining at 37°C for 30 min in PBS buffer. Afterward, cells were stained with the following antibodies (each used at 1:300 dilution): anti‐CD4‐BV650 (clone RM4‐5), anti‐CD8‐BV510 (clone 53–6.7), anti‐Vα2‐PE‐Cy7 (clone B20.1), anti‐Vβ8.3‐FITC (clone 1B3.3). For identification of Treg cells, anti‐CD25‐PE (clone PC61) and anti‐APC‐tetramers were used, followed by intracellular staining after fixation and permeabilization using the FoxP3/Transcription staining buffer set (eBioscience) following the manufacturer's protocol and anti‐Foxp3‐eFLUOR450 (clone FJK‐16s). The tetramer was kindly provided by the NIH Tetramer Core Facility at Emory University. FACS analysis was done in LSRFortessa and FACSymphony analyzers, and cell sorting was done using a FACSAria instrument (BD Biosciences).
4.3. Repertoire Sequencing
After RNA extraction from sorted cells using the TRI Reagent (ThermoFisher) according to the manufacturer's instructions, cDNA synthesis was carried out, primed with oligo(dT) (5′‐AAGCAGTGGTATCAACGCAGAGTTTTTTTTTTTTTTTTTTTTTTTTVN) using SMARTScribe Reverse Transcriptase (Clontech); during the first‐strand synthesis, 5′‐RACE adaptors (5′‐AAGCAGUGGTAUCAACGCAGAGUNNNNUNNNNUNNNNUCTT[rGrGrGrGrG]) containing a UMI‐barcode were introduced through the template switching activity of the enzyme. Hemi‐nested PCR amplification with gene‐specific primers and adaptor binding primers was performed as follows. In the first round, a mixture of UPM_S primer (5′‐CTAATACGACTCACTATAGGGC), and UPM_L primer (5′‐CTAATACGACTCACTATAGGGCAAGCAGTGGTATCAACGCAGAGT) and OBG_183_ii (5′‐ GCAGAGGGTGCTGTCCTGAGACCGAG; for TCR alpha chain) or OBG_182_ii (5′‐CAATCTCTGCTCTTGATGGCTCAAACAAGGAGACC; for TCR beta chain) were used; in the second round, the UPM_S and UPM_L primers were used with equimolar mixtures of OBG_141 (5′‐ acactctttccctacacgacgctcttccgatctNNNNNCAGGTTCTGGGTTCTGGATGT), OBG_142 (5′‐acactctttccctacacgacgctcttccgatctNNNNNNCAGGTTCTGGGTTCTGGATGT), and OBG_143 (5´‐ acactctttccctacacgacgctcttccgatctNNNNNNNCAGGTTCTGGGTTCTGGATGT) for TCR alpha chain, or OBG_137 (5′‐ acactctttccctacacgacgctcttccgatctNNNNGGAGTCACATTTCTCAGATCC), OBG_138 (5′‐ acactctttccctacacgacgctcttccgatctNNNNNGGAGTCACATTTCTCAGATCC), and OBG_139 (5′‐acactctttccctacacgacgctcttccgatctNNNNNNGGAGTCACATTTCTCAGATCC) for TCR beta chain were used. The amplification conditions for the first round were as follows: Step 1: 98°C for 90 s; followed by 20 cycles of 98°C (10 ), 68°C (20 )72°C (45 s), and finally 72°C (8 min). The amplification conditions for the second round were the same, except that only 15 cycles were used. The resulting TCR alpha and beta amplicons were sequenced on an Illumina MiSeq instrument (read length of 300 bp).
4.4. Repertoire Analysis
The sequences of UMI‐barcoded cDNAs were classified as Tra or Trb assemblies based on C region sequence signatures (Trac: 5´‐ GTTCTGGATGT, Trbc: 5´‐ TTTCTCAGATC). The CDR3 regions were identified based on the presence of the conserved cysteine (V region), and phenylalanine (J region) residues, following the IMGT nomenclature [27]. A table was generated from the extracted CDR3 sequences; CDR3 sequences were included only when UMI‐CDR3 pairs were represented at least three times in an individual sequence collection. The mRNA counts depicted in CDR3 length plots and the sizes of network nodes reflect the UMI counts obtained in this table. Typically, the sequence complexities of individual samples were found to be in the order of 103 to 104; since our protocol accommodates 412 (or ∼107) different UMIs, UMI collision (i.e., the occurrence of two reads with the same sequence and same UMI barcode, but originating from two different cDNA molecules) was deemed to be irrelevant for the analysis. As expected for the Rag2 −/− background, inspection of the tables showed no background recombination, that is, usage of V and J segments other than those of the Sm transgene. Network analysis was performed using the igraph package implemented in R.
Author Contributions
Thomas Boehm conceived the study. Thomas Boehm and Orlando B. Giorgetti designed the study. Orlando B. Giorgetti developed the bioinformatics tools. Orlando B. Giorgetti and Thomas Boehm analyzed data. Orlando B. Giorgetti and Annette Haas‐Assenbaum performed experiments. Thomas Boehm wrote the paper with input from all authors.
Ethics Statement
All animal experiments were performed in accordance with the relevant guidelines and regulations, approved by the review committee of the Max Planck Institute of Immunobiology and Epigenetics and the Regierungspräsidium Freiburg, Germany (license 35–9185.81/G‐15/36).
Conflicts of Interest
The authors declare no conflicts of interest.
Peer Review
The peer review history for this article is available at https://publons.com/publon/10.1002/eji.202451434.
Supporting information
Supporting Information
Acknowledgments
We thank the late M. Kijima and B. Kanzler for help with the preparation of the sgRNA constructs and the creation of transgenic lines, respectively, and the NIH Tetramer Core Facility at Emory University for provision of the I‐Ab DIYKGVYQFKSV‐PE‐Tetramer. We thank Hanspeter Pircher for the discussions and critical reading of the manuscript.
Open access funding enabled and organized by Projekt DEAL.
Funding: The financial support was provided by the Max Planck Society and the Deutsche Forschungsgemeinschaft (Project 256073931‐SFB1160).
Data Availability Statement
The primary sequence data used in this paper are available at the NCBI sequence read archive (https://www.ncbi.nlm.nih.gov/sra) under BioProject PRJNA1128587. The R code for data analysis can be found on GitHub (github.com/obgiorgetti/TCR_diversification).
References
- 1. Kohlgruber A. C., Dezfulian M. H., Sie B. M., et al., “High‐Throughput Discovery of MHC Class I‐ and II‐restricted T Cell Epitopes Using Synthetic Cellular Circuits,” Nature Biotechnology (2024), 10.1038/s41587-024-02248-6. [DOI] [PubMed] [Google Scholar]
- 2. Zdinak P. M., Trivedi N., Grebinoski S., et al., “De Novo Identification of CD4+ T Cell Epitopes,” Nature Methods 21 (2024): 846–856. [DOI] [PMC free article] [PubMed] [Google Scholar]
- 3. Moravec Z., Zhao Y., Voogd R., et al., “Discovery of Tumor‐Reactive T Cell Receptors by Massively Parallel Library Synthesis and Screening,” Nature Biotechnology (2024), 10.1038/s41587-024-02210-6. [DOI] [PubMed] [Google Scholar]
- 4. Koo D., Mao Z., Dimatteo R., et al., “Defining T Cell Receptor Repertoires Using Nanovial‐Based Binding and Functional Screening,” Proceedings of the National Academy of Sciences of the United States of America 121 (2024): e2320442121. [DOI] [PMC free article] [PubMed] [Google Scholar]
- 5.: Meyer M., Parpoulas C., Barthélémy T., et al., “MediMer: A Versatile Do‐it‐Yourself Peptide‐Receptive MHC Class I Multimer Platform for Tumor Neoantigen‐Specific T Cell Detection,” Frontiers in immunology 14 (2024): 1294565. [DOI] [PMC free article] [PubMed] [Google Scholar]
- 6. Kovaleva V. A., Pattinson D. J., Barton C., et al., “copepodTCR: Identification of Antigen‐Apecific T Cell Receptors With Combinatorial Peptide Pooling,” BioRxiv (2023), 10.1101/2023.11.28.569052. [DOI] [Google Scholar]
- 7. Dezfulian M. H., Kula T., Pranzatelli T., et al., “TScan‐II: A Genome‐Scale Platform for the De Novo Identification of CD4+ T Cell Epitopes,” Cell 186 (2023): 5569–5586.e21. [DOI] [PMC free article] [PubMed] [Google Scholar]
- 8. Croce G., Bobisse S., Moreno D. L., et al., “Deep Learning Predictions of TCR‐Epitope Interactions Reveal Epitope‐Specific Chains in Dual Alpha T Cells,” Nature Communications 15 (2024): 3211. [DOI] [PMC free article] [PubMed] [Google Scholar]
- 9. Jensen M. F. and Nielsen M., “Enhancing TCR Specificity Predictions by Combined Pan‐ and Peptide‐Specific Training, Loss‐Scaling, and Sequence Similarity Integration,” Elife 12 (2023): RP93934. [DOI] [PMC free article] [PubMed] [Google Scholar]
- 10. Ortega M. R., Pogorelyy M. V., Minervina A. A., Thomas P. G., Walczak A. M., and Mora T., “Learning Predictive Signatures of HLA Type From T‐Cell Repertoires,” BioRxiv (2024), 10.1101/2024.01.25.577228. [DOI] [PMC free article] [PubMed] [Google Scholar]
- 11. Korpela D., Jokinen E., Dumitrescu A., Huuhtanen J., Mustjoki S., and Lähdesmäki H., “EPIC‐TRACE: Predicting TCR Binding to Unseen Epitopes Using Attention and Contextualized Embeddings,” Bioinformatics 39 (2023): btad743. [DOI] [PMC free article] [PubMed] [Google Scholar]
- 12. Textor J., Buytenhuijs F., Rogers D., et al., “Machine Learning Analysis of the T Cell Receptor Repertoire Identifies Sequence Features of Self‐Reactivity,” Cell Systems 14 (2023): 1059–1073.e5. [DOI] [PubMed] [Google Scholar]
- 13. Racle J., Guillaume P., Schmidt J., et al., “Machine Learning Predictions of MHC‐II Specificities Reveal Alternative Binding Mode of Class II Epitopes,” Immunity 56 (2023): 1359–1375.e13. [DOI] [PubMed] [Google Scholar]
- 14. Camaglia F., Ryvkin A., Greenstein E., et al., “Quantifying Changes in the T Cell Receptor Repertoire During Thymic Development,” Elife 12 (2023): e81622. [DOI] [PMC free article] [PubMed] [Google Scholar]
- 15. Khatun A., Kasmani M. Y., Zander R., et al., “Single‐cell Lineage Mapping of a Diverse Virus‐Specific Naive CD4 T Cell Repertoire,” Journal of Experimental Medicine 218 (2021): e20200650. [DOI] [PMC free article] [PubMed] [Google Scholar]
- 16. Oxenius A., Bachmann M. F., Zinkernagel R. M., and H. Hengartner, “Virus‐Specific MHC‐class II‐Restricted TCR‐transgenic Mice: Effects on Humoral and Cellular Immune Responses After Viral Infection,” European Journal of Immunology 28 (1998): 390–400. [DOI] [PubMed] [Google Scholar]
- 17. Kim J. M., Rasmussen J. P., and Rudensky A. Y., “Regulatory T Cells Prevent Catastrophic Autoimmunity Throughout the Lifespan of Mice,” Nature Immunology 8 (2007): 191–197. [DOI] [PubMed] [Google Scholar]
- 18. Platt R. J., Chen S., Zhou Y., et al., “CRISPR‐Cas9 Knockin Mice for Genome Editing and Cancer Modeling,” Cell 159 (2014): 440–455. [DOI] [PMC free article] [PubMed] [Google Scholar]
- 19. Hennet T., Hagen F. K., Tabak L. A., and Marth J. D., “T‐Cell‐Specific Deletion of a Polypeptide N‐Acetylgalactosaminyl‐Transferase Gene by Site‐Directed Recombination,” Proceedings of the National Academy of Sciences 92 (1995): 12070–12074. [DOI] [PMC free article] [PubMed] [Google Scholar]
- 20. Shinkai Y., Rathbun G., Lam K. P., et al., “RAG‐2‐Deficient Mice Lack Mature Lymphocytes Owing to Inability to Initiate V(D)J Rearrangement,” Cell 68 (1992): 855–867. [DOI] [PubMed] [Google Scholar]
- 21. Giorgetti O. B., O'Meara C. P., Schorpp M., and Boehm T., “Origin and Evolutionary Malleability of T Cell Receptor α Diversity,” Nature 619 (2023): 193–200. [DOI] [PMC free article] [PubMed] [Google Scholar]
- 22. Buckland J., Pennington D. J., Bruno L., and Owen M. J., “Co‐Ordination of the Expression of the Protein Tyrosine Kinase p56(lck) With the Pre‐T Cell Receptor During Thymocyte Development,” European Journal of Immunology 30 (2000): 8–18. [DOI] [PubMed] [Google Scholar]
- 23. Katz J. D., Wang B., Haskins K., Benoist C., and Mathis D., “Following a Diabetogenic T Cell From Genesis Through Pathogenesis,” Cell 74 (1993): 1089–1100. [DOI] [PubMed] [Google Scholar]
- 24. Uematsu Y., Ryser S., Dembić Z., et al., “In Transgenic Mice the Introduced Functional T Cell Receptor Beta Gene Prevents Expression of Endogenous Beta Genes,” Cell 52 (1998): 831–841. [DOI] [PubMed] [Google Scholar]
- 25. Blüthmann H., Kisielow P., Uematsu Y., et al., “T‐Cell‐Specific Deletion of T‐Cell Receptor Transgenes Allows Functional Rearrangement of Endogenous Alpha‐ and Beta‐genes,” Nature 334 (1988): 156–159. [DOI] [PubMed] [Google Scholar]
- 26. Signorelli K., Benoist C., and Mathis D., “Why is Clonal Deletion of Neonatal Thymocytes Defective?,” European Journal of Immunology 22 (1992): 2487–2493. [DOI] [PubMed] [Google Scholar]
- 27. Manso T., Folch G., Giudicelli V., et al., “IMGT® Databases, Related Tools and Web Resources Through Three Main Axes of Research and Development,” Nucleic Acids Research 50(D1) (2022): D1262–D1272. [DOI] [PMC free article] [PubMed] [Google Scholar]
Associated Data
This section collects any data citations, data availability statements, or supplementary materials included in this article.
Supplementary Materials
Supporting Information
Data Availability Statement
The primary sequence data used in this paper are available at the NCBI sequence read archive (https://www.ncbi.nlm.nih.gov/sra) under BioProject PRJNA1128587. The R code for data analysis can be found on GitHub (github.com/obgiorgetti/TCR_diversification).