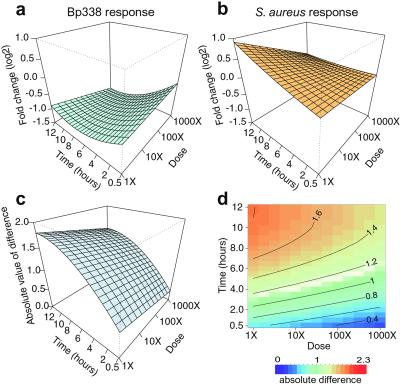
Figure 3.
Dose–response patterns reveal discrimination. The modeled expression profile of CD64 is shown in response to B. pertussis (a) and S. aureus (b) treatments as an example (surfaces fitted by using four independent measurements). The x axis represents time; the y axis, exposure dose; and the z axis, the expression level (log2) of the zero-transformed data. The surface represents the least-squares fit of the expression data to the model. The correlation of fitted to observed responses was 0.83. (c) The subtraction of the two expression surfaces, Δ(d, t). (d) The same fitted response difference as in c, but in the form of a two-dimensional color image and contour plot, in which a red to blue color scale represents high to low absolute difference, respectively. Further examples are shown in Fig. 8 in the supporting information.

