
Figure 6.
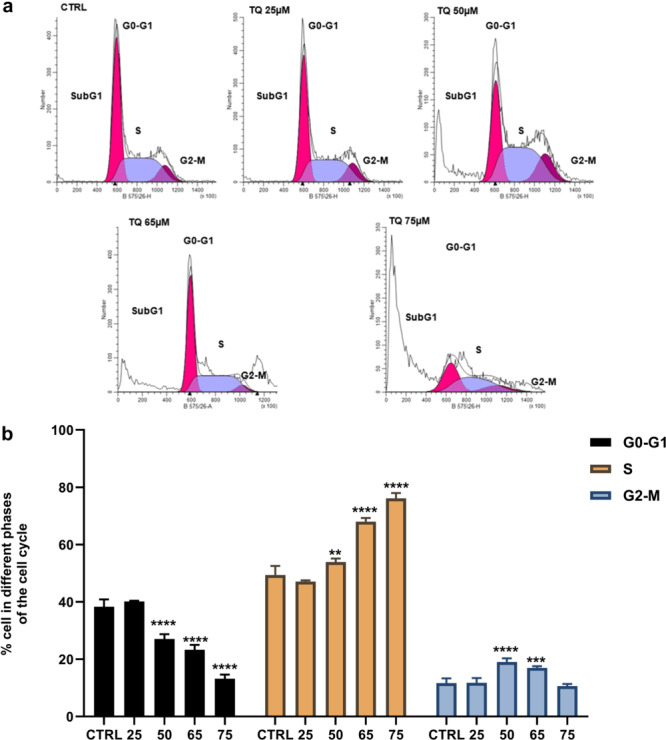
MDA‐MB‐231 cell cycle analysis. Cells were incubated for 24 h with TQ at concentrations of 25, 50, 65, and 75 µM. (a) Flow cytometric analysis of the distribution of the cells in the different phases of the cell cycle. (b) The quantification of the cells in the different phases, data are the mean ± SD of three independent experiments performed in triplicate. Comparisons of the data were performed using Two‐way ANOVA test followed by Tukey's post‐test. Statistically significant differences were observed for each condition vs control cells with **p < 0.01, ****p < 0.0001.