

Abstract
Macrophage infiltration and activation is a key factor in the progression of diabetic nephropathy (DN). However, aerobic glycolysis induced by m6A methylation modification plays a key role in M1‐type activation of macrophages, but the specific mechanism remains unclear in DN. In this study, the expression of m6A demethylase Fto in bone marrow derived macrophages and primary kidney macrophages from db/db mice. Loss and gain‐of‐function analysis of Fto were performed to assess the role of Fto in DN. Transcriptome and MeRIP‐seq association analysis was performed to identified the target gene was Npas2. In this study, we found that demethylase Fto exhibits low expression in type 2 DN m6A modification of Npas2 mediated by Fto regulates macrophages M1‐type activation and glucose metabolism reprogramming to participate in the process of DN. Furthermore, Fto reduces the m6A modification level of Npas2 in macrophages through a Prrc2a‐dependent mechanism, and decreasing its stability. This process mediates inflammation and glycolysis in M1 macrophages by regulating the Hif‐1α signaling pathway. Fto may act as a suppressor of M1 macrophages inflammation and glycolysis in DN through the m6A/Npas2/Hif‐1α axis. This findings providing a new basis for the prevention and treatment of DN.
Keywords: Fto, glycolysis, macrophage, N6‐methyladenosine, Npas2, Prrc2a
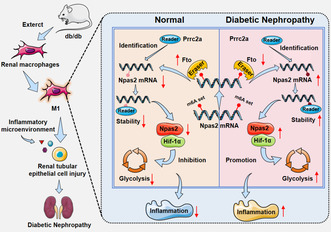
Fto could reshape m6A methylation level in macrophages and cooperate with reading protein Prrc2a reduces Npas2 stability, combining Hif‐1α reduces macrophages in the inflammatory and glycolysis, through the m6A/Npas2/Hif‐1α axis to participate in the process of DN.
Abbreviations
- Alkbh5
AlkB homolog 5
- Arg1
Arginase1
- BMDM
Bone marrow derived macrophages
- BUN
Blood urea nitrogen
- Fto
Fat mass and obesity‐associated protein
- HG
High glucose
- Hif‐1α
Hypoxia‐inducible factor‐1α
- Hk1
Hexokinase 1
- Il‐1β
Interleukin 1 beta
- iNOS
i nitric oxide synthase
- Kim‐1
Kidney Injury Molecule 1
- Mcp‐1
Chemokine ligand 2
- Mettl14
Methyltransferase‐like 14
- Mettl3
Methyltransferase‐like 3
- Npas2
Neuronal PAS domain protein 2
- Pfkfb3
6‐phosphofructo‐2‐kinase/fructose‐2,6‐bisphosphatase 3
- Prrc2a
Proline rich coiled‐coil 2 A
- Tnf‐α
Tumor necrosis factor alpha
- Wtap
Wilms tumor 1‐associated protein
1. INTRODUCTION
Diabetic nephropathy (DN), a primary cause of chronic kidney disease (CKD), is a prevalent microvascular complication associated with diabetes, 1 , 2 characterized by pronounced infiltration and activation of macrophage (Mφ). 3 , 4 , 5 , 6 Recently, the pivotal role of Mφ activation in DN pathogenesis has garnered significant attention. Interestingly, several studies have demonstrated that interventions targeting M1–Mφ polarization inhibition can effectively mitigate kidney injury in experimental models of diabetes. 4 , 5 Therefore, investigating the regulatory mechanisms underlying macrophage phenotypic imbalance and identifying effective strategies for modulating macrophage activation are pivotal in addressing this issue.
Research has proved that immune cells undergo metabolic reprogramming in response to local pathogen‐derived signals and cytokines, and these alterations in cellular metabolism exert an influence on the elicited immune response. 7 , 8 , 9 During the process of DN, M1‐activated macrophages exhibit increased glucose consumption and lactate synthesis, accompanied by elevated capacity of glycolytic. 10 , 11 Furthermore, methylation of m6A is a prevalent RNA modification observed in mammalian eukaryotic cells, 12 which predominantly occurs at the N 6 position of adenosine in RNA. 13 This modification is most commonly found in the 3′UTR region and follows the RRACH ([G>A] m6AC[U>A>C]) sequence. 14 The dynamic and reversible process is regulated by the interplay between methyltransferases (writers), demethylases (erasers), and RNA‐binding proteins (readers) that govern methylation, demethylation, and recognition of methylation, respectively. 15 Recently, studies have discovered that m6A modification is widely involved in gene expression by regulating processes such as RNA splicing, stability, and localization, thus controlling the progression of DN. 16 Additionally, compelling evidence suggests that m6A exerts regulatory control over macrophage metabolism through multiple pathways, thereby significantly influencing the pathogenesis and progression of diseases. 17 , 18 , 19
In this study, we observed an upregulation of m6A methylation levels both in vivo and in vitro of DN and identified a significant decrease in the expression of fat mass and obesity‐associated protein (Fto). In conjunction with metabolomics and seahorse analysis, Fto modulates macrophage glycolysis and phenotypic transformation through m6A modification of neuronal PAS domain protein 2 (Npas2). Further analysis revealed that Fto exerts its activity by modulating the m6A/Npas2/Hypoxia‐inducible factor‐1α (Hif‐1α) signaling pathway. The findings of this study provide novel insights into the potential mechanism underlying m6A modification in regulating glycolysis and activation of macrophages in DN.
2. MATERIALS AND METHODS
2.1. Model of diabetic
The animal experiments were conducted in the specific pathogen‐free (SPF) animal laboratory at Anhui Medical University and received approval from the Ethics Committee for Animal Research at Anhui Medical University (No. 20220091). Male C57BKS‐Lepr −/− (db/db) mice were procured from GemPharmatech (n = 6–8) (Nanjing, China). The animal experiments were conducted under controlled conditions by standard protocols. The 1 × 10¹² virus (100 UL titer) was administered via tail vein injection using an insulin needle. After the completion of 20 weeks, urine samples were collected from mice in metabolic cages for 24 h. Additionally, kidneys were collected for electron microscopy examination, paraffin embedding, and molecular biological analysis. Mice were euthanized in humanely after receiving anesthesia.
2.2. Isolation and culture of bone marrow‐derived macrophages (BMDMs) and primary kidney macrophages
Previously, methods were employed for the isolation of primary kidney macrophages 20 and BMDMs. 21 Briefly, in situ perfusion was conducted using collagenase followed by differential centrifugation based on a density gradient. Renal macrophages were isolated from the kidneys of euthanized mice and pre‐incubated with a medium containing either collagenase I or IV (100 mg/kidney) at 37°C in a water bath. Subsequently, cellular separation was achieved through 40% Percoll density gradient centrifugation after employing red blood cells (RBCs) for filtration. Additionally, tibias and femurs were dissected from mice by performing a precise incision at the knee joint. Subsequently, bone marrow was carefully extracted and cultured in cell dishes. Following a period of 7 days, the bone marrow cells underwent terminal differentiation into macrophages.
2.3. Flow cytometry analysis
The isolated cells were resuspended in PBS and passed through a 70‐μm strainer. Subsequently, the samples were incubated with FITC‐conjugated Anti‐Cd11b (BD Biosciences, USA) and PE‐conjugated Anti‐F4/80 (BD Biosciences, USA) antibodies. The antibody‐cell mixture was incubated at 4°C for 30 min in darkness. Following this, the cells were washed with 0.1 mM PBS solution. Macrophages were identified as Cd11b+ and F4/80+ cells for subsequent experiments, and relative data analysis was performed using CytExpert software (Beckman Coulter, USA).
2.4. Western blot
The protein samples were transferred onto a PVDF membrane (Millipore, USA). 22 , 23 In this study, the following antibodies were used for western blotting: β‐actin (Sino Biological Inc., 100166‐MM10), iNOS (Abcam, ab178945), Fto (Abcam, ab280081), Hk1 (Abcam, ab150423), Pfkfb3 (Abcam, ab181861), and Prrc2a (Santa, sc‐373747). Subsequently, the PVDF membranes were incubated with HRP‐coupled secondary antibodies (1:1000 dilution; ZSGB‐Bio, China) at room temperature for 60 min. The protein signals were detected using the Amersham Imager 600 System.
2.5. RNA isolation and qRT‐PCR
Trizol (Invitrogen, USA) was used to extract the total RNA from tissues and cells according to the manufacturer's instructions. The concentration and purity of RNA were determined using Spectrophotometer NanoDrop 2000 (Thermo Scientific, USA), while cDNA amplification was performed with PrimeScript™RT Master Mix (Takara, Japan). 24 β‐actin was utilized as an internal control for normalization purposes. The primer sequences employed in this study are provided in Table S1.
2.6. siRNA‐Fto, overexpression Fto, siRNA‐Npas2, and siRNA‐Prrc2a transfection
The small interfering RNAs (siRNAs) and Fto overexpression plasmid were synthesized by Hanheng Biotechnology (Shanghai, China). BMDM cells were transfected with siRNA and plasmid using Lipofectamine™ 2000 (Invitrogen, USA). Transfection efficiency was assessed using qRT‐PCR analysis. The relative sequence is presented in Table S2.
2.7. Human samples
The clinical information was obtained with informed consent from patients and conducted by the Declaration of Helsinki. It received approval from the Research Ethics Committee of the First Affiliated Hospital of Anhui Medical University (No. 2022084). Kidney biopsy specimens were collected from the Department of Nephrology at the same hospital. Type 2 diabetes mellitus (DM) patients were recruited based on the following criteria: (1) confirmed diagnosis of type 2 diabetes; (2) renal biopsy confirming DN; (3) presence of albumin protein in urine exceeding 30 mg/24 h; and (4) absence of fever, infection, cancer, or autoimmune diseases.
2.8. Histology and immunohistochemistry
The kidney tissues, which were fixed in 4% paraformaldehyde and embedded in paraffin, were sectioned at a thickness of 4 μm for immunohistochemical staining using F4/80 antibody (Bioss, bsm‐34 028 M). Additionally, H&E and PAS staining as well as scanning electron microscope analysis were performed to evaluate the kidney pathology. The sections were scanned using a digital slide scanner (Pannoramic MIDI, 3DHISTECH, Hungary).
2.9. m6A MeRIP‐qRT‐PCR
RNA was extracted from BMDMs with Fto overexpression or corresponding controls under HG stimulation, fragmented into 100–150 nt fragments, and subjected to m6A immunoprecipitation using an m6A antibody followed by qRT‐PCR analysis of m6A enrichment. Briefly, fragmented RNA was incubated with the m6A antibody in RIP immunoprecipitation buffer overnight at 4°C, then treated with proteinase K buffer at 55°C for 30 min. The mRNA fraction enriched for m6A was purified using Trizol and detected by RT‐PCR.
2.10. Dot blot
The extracted RNA was subjected to a 5‐min boiling step at 90°C using a metal bath, followed by immediate cooling. The RNA sample was then spotted onto the surface of a nylon membrane and exposed to UV light for 2 h. The membrane was immersed in 5% skimmed milk, sealed on a shaker at room temperature for 2 h, and incubated with m6A antibody (Synaptic Systems, 202003) overnight. On a subsequent day, the nylon membrane was washed three times with Tris‐buffered saline containing 0.1% Tween 20 detergent (TBST) at room temperature. Subsequently, the secondary antibody was applied and detection was performed using the Amersham Imager 600 System. Another membrane was stained with methylene blue.
2.11. Luciferase reporter assay
Transfection of BMDMs was performed with a luciferase reporter vector, incorporating Npas2‐5′UTR fused with either wild‐type or mutant Npas2‐5′UTR. We specifically eliminated the high‐confidence GGACU motif near the stop codon. Subsequently, the activity of firefly and renilla luciferase was quantified using the Dual‐Luciferase system (Promega, USA) as per the manufacturer's instructions and detected using GloMax Multi Jr (Promega, USA).
2.12. SMR analysis and data sources
The SMR analysis and HEIDI test were performed using the software SMR (http://cnsgenomics.com/software/smr/download.html). We adopted the default settings in SMR; detailed information regarding the SMR method can be found in a previous publication 1. FDR <0.05 was considered statistically significant for SMR analysis. The summary statistic of DN was obtained from the FinnGen biobank (R9 release) including 3256 cases and 255 679 controls (https://r9.finngen.fi/). The blood eQTL data were from eQTLGen (https://www.eqtlgen.org/cis‐eqtls.html) 2 and GTEx V8_Whole_blood (https://yanglab.westlake.edu.cn/data/SMR/GTEx_V8_cis_eqtl_summary.html) 3.
All data used in this study were obtained from public databases.
2.13. m6A‐mRNA epitranscriptomic microarray
The sample preparation and microarray hybridization were conducted following the standard protocols provided by Arraystar. Acquired array images were analyzed using Agilent Feature Extraction software. Raw intensities of immunoprecipitation (IP) (Cy5‐labeled) and supernatant (Sup) (Cy3‐labeled) were normalized with the average log2‐scaled spike‐in RNA intensities.
2.14. Statistical analysis
The data collected from this research were analyzed using mean ± SEM and subjected to one‐way analysis of variance (ANOVA), followed by the Newman–Keuls post hoc test (Prism 8.0 GraphPad Software, USA). Pearson's correlation coefficient assay was employed to examine expression correlations. p‐value <.05 was considered statistically significant.
3. RESULTS
3.1. Association of DN in type 2 diabetes with low levels of Fto in macrophage
We observed a significant increase in m6A RNA modifications in db/db mice and HG‐induced BMDMs (Figure 1A,B), and performed sequencing on BMDMs stimulated with HG, and further validated our findings using primary kidney macrophages (Mφ) extracted from db/db mice (Figure 1C). The histopathological findings of db/db mice revealed thickening of the glomerular basement membrane and presence of inflammatory infiltration in the model group (Figure S1A). Serum creatinine, blood urea nitrogen, and 24‐h urinary albumin levels exhibited significant elevation (Figure S1B), along with increased expression of kidney injury molecule 1 (Kim1), interleukin 1 beta (Il‐1β), tumor necrosis factor alpha (Tnf‐α), and chemokine ligand 2 (Mcp1) (Figure S1C). Furthermore, in conjunction with sequencing data (Supplemental File S1) and Western blot results, we observed a significant downregulation of m6A‐demethylase Fto expression, which was consistent with the aforementioned findings in primary macrophages of db/db mice (Figures 1D and S2A,B). Immunofluorescence results demonstrated the co‐localization of Fto with F4/80 in the kidney tissue of db/db mice (Figure 1E). qRT‐PCR analysis revealed a negative correlation between the expression of Fto and inflammatory factors in primary Mφ cells (Figures 1F and S2C). Immunofluorescence staining results revealed a significant correlation between Fto expression and creatinine, urea nitrogen, and 24 h urinary albumin in F4/80+ macrophages of db/db mice (Figure S2D). In addition, in renal tissue obtained from patients clinically diagnosed with type 2 DN, Fto was observed to co‐localize with the macrophage marker Cd68 in kidney puncture samples collected from individuals with DN (Figure 1G). The clinical correlation results demonstrated a significant association between reduced Fto expression in macrophages and patients' blood creatinine levels, glomerular filtration rate, and urinary albumin levels (Figure 1H).
FIGURE 1.
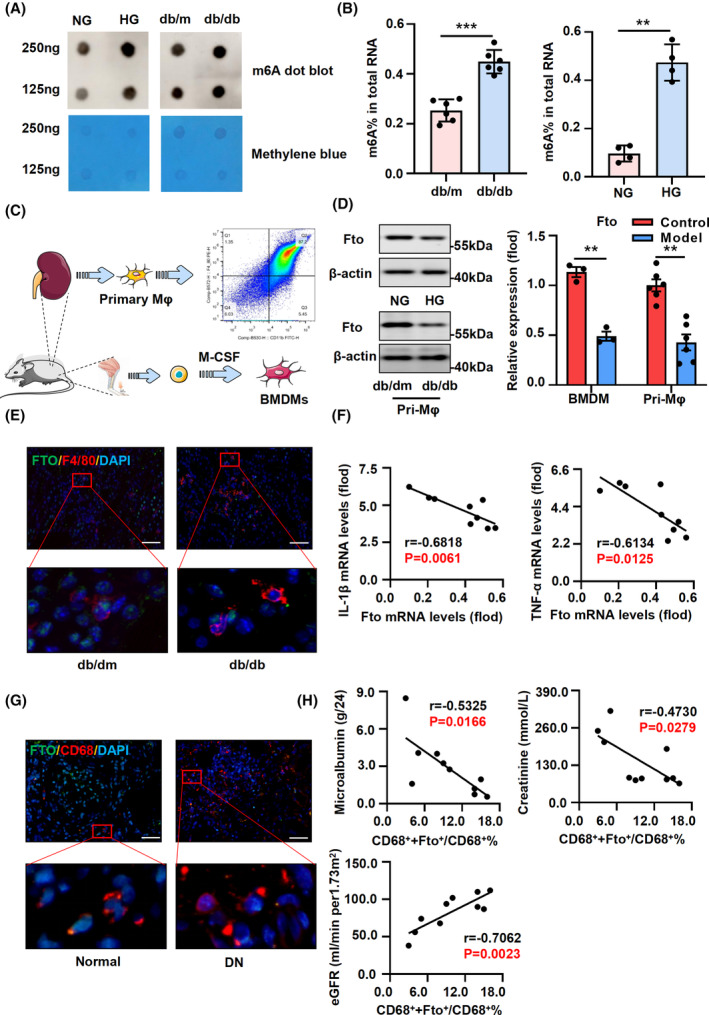
Association of DN in type 2 diabetes with low levels of Fto in macrophage. (A) The m6A level of kidney mRNA in HG‐stimulated BMDMs and db/db mice was detected by a dot blot experiment. The m6A level of poly(A) + RNAs isolated from total RNA was indicated by the m6A dot blot (gray stripe). Methylene blue (MB) staining served as a loading control (blue stripe). (B) The global level of mRNA m6A modification in HG‐stimulated BMDMs and db/db mice was determined by colorimetric ELISA‐like assay. (C) The extraction procedures and identification of BMDMs and primary kidney macrophages. (D) The expression of Fto in HG‐stimulated BMDMs and primary kidney macrophages (Mφ) was detected by western blot. (E) Immunofluorescence of Fto and F4/80 in diabetic mice. (F) The expression of Fto was negatively correlated with Il‐1β and Tnf‐α in primary Mφ by qRT‐PCR. (G) Immunofluorescence of Fto and Cd68 in renal biopsies from patients. (H) Low Fto expression in macrophages was closely correlated with patients' blood creatinine, glomerular filtration rate, and urinary albumin levels. Representative images were presented; scale bar, 20 μm. The data represent the mean ± SEM. **p < .01, ***p < .001 versus db/m and NG group (B) and control group (D).
3.2. Fto overexpression alleviates inflammation and decreases the M1‐macrophages in HG‐stimulated
Overexpression plasmids and siRNA targeting Fto were constructed, and their transfection efficiency was confirmed by silencing or overexpressing Fto in BMDMs (Figure S3A). The overexpression of Fto in HG‐stimulated BMDMs resulted in the enrichment of inflammation‐related pathways (Figure 2A). An upregulation of inflammatory cytokines in HG‐stimulated BMDMs accompanied by dysregulated expression of M1/2 macrophage markers (Figure S3B). Notably, Fto overexpression attenuated the release of Il‐1β, Tnf‐α, and Mcp‐1 (Figure 2B). The expression of Fto exhibited a negative correlation with i nitric oxide synthase (iNOS) but a positive correlation with Arginase1 (Arg1) in primary macrophages (Figures 2C and S3C). Moreover, we assessed the mRNA levels of Il‐1β, Tnf‐α, and Mcp‐1 (Figure S4A). Flow cytometry analysis revealed that the augmented proportion of F4/80+ and Cd86+ double‐positive cells was attenuated upon overexpression of Fto (Figure 2D). The overexpression of Fto resulted in a decrease in the mRNA and protein expression of iNOS, while it led to an increase in the expression of Arg1 (Figures 2E and S4B,C). Additionally, knockdown of Fto significantly enhanced the production and secretion of Il‐1β, Tnf‐α, and Mcp‐1 (Figures 2F and S4D), upregulated the expression of iNOS (Figures 2G and S4F), as well as promoted the proportion of double‐positive cells for F4/80+ and Cd86+ markers (Figure 2H). Silencing of Fto did not exert a significant impact on the levels of Arg1 protein and mRNA (Figure S4E,F).
FIGURE 2.
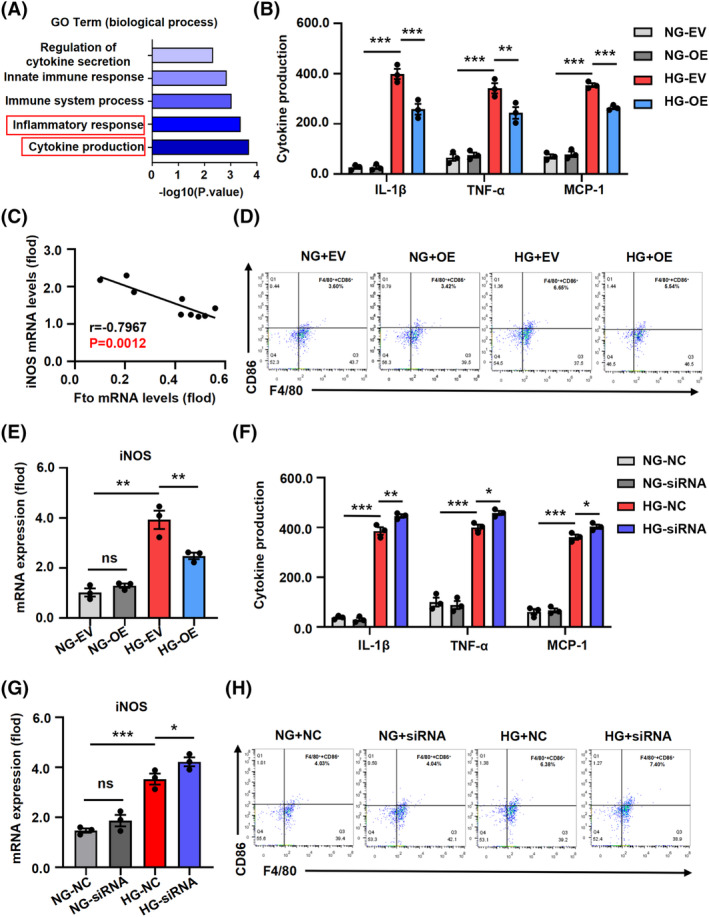
Fto overexpression alleviates inflammation and decreases the M1‐macrophages in HG‐stimulated. (A) Inflammation‐related pathways were enriched in HG‐stimulated BMDM following Fto overexpression. (B) Fto overexpression decreased the release of inflammatory factors and chemokines such as Il‐1β, Tnf‐α, and Mcp‐1 by ELISA. (C) The expression of Fto was negatively correlated with iNOS in primary Mφ. (D) The proportion of F4/80+ and Cd86+ double‐positive cells in HG‐induced BMDM was reduced with the overexpression of Fto by flow cytometry. (E) Increasing the expression of Fto reduced the mRNA expression of iNOS in HG‐stimulated BMDMs. (F) Silencing Fto significantly increased the production and secretion of inflammatory cytokines and chemokines (Il‐1β, Tnf‐α, and Mcp‐1). (G) Suppressing the expression of Fto increased the mRNA expression of iNOS in HG‐stimulated BMDMs. (H) The proportion of F4/80+ and Cd86+ double‐positive cells in HG‐induced BMDM was increased with the downexpression of Fto by flow cytometry. The data represent the mean ± SEM. *p < .05, **p < .01, ***p < .001 versus db/m and HG‐EV group (B and E) and HG‐NC group (F and G).
3.3. Overexpression of Fto decreases the glycolysis of HG‐stimulated macrophages
Recent studies have demonstrated the crucial involvement of glucose metabolism in macrophage activation. We conducted an overexpression of Fto in HG‐stimulated BMDMs, followed by metabolomics sequencing analysis (Supplemental File S2). Overexpression of Fto led to the enrichment of glycolysis‐related metabolic pathways compared with the NC group (Figure 3A,B). Additionally, we observed an enhancement in lactate production and glucose uptake in BMDMs under HG conditions (Figure S5A), along with upregulation of glycolysis‐related proteins Hexokinase 1 (Hk1) and 6‐phosphofructo‐2‐kinase/fructose‐2, 6‐bisphosphatase 3 (Pfkfb3) in HG‐stimulated BMDM and db/db kidney tissues (Figure S5B,C). The expression of Fto exhibited a negative correlation with Hk1 and Pfkfb3 in primary macrophages (Figure S5D). Overexpression of Fto effectively attenuated lactate production and glucose uptake in HG‐induced BMDMs (Figure 3C) and resulted in a dampened expression of Hk1 and Pfkfb3 (Figure 3D,E). Furthermore, overexpression of Fto significantly diminished the glycolytic capacity (ECAR) of HG‐induced BMDMs (Figure 3F). Silencing Fto resulted in accelerated lactate production and enhanced glucose uptake in HG‐stimulated BMDMs (Figure 3G), along with increased expression levels of Hk1 and Pfkfb3 (Figure 3H,I). Moreover, in conjunction with the further downregulation of Fto expression, silencing Fto additionally enhanced glycolytic capacity (ECAR) in HG‐induced BMDMs (Figure 3J).
FIGURE 3.
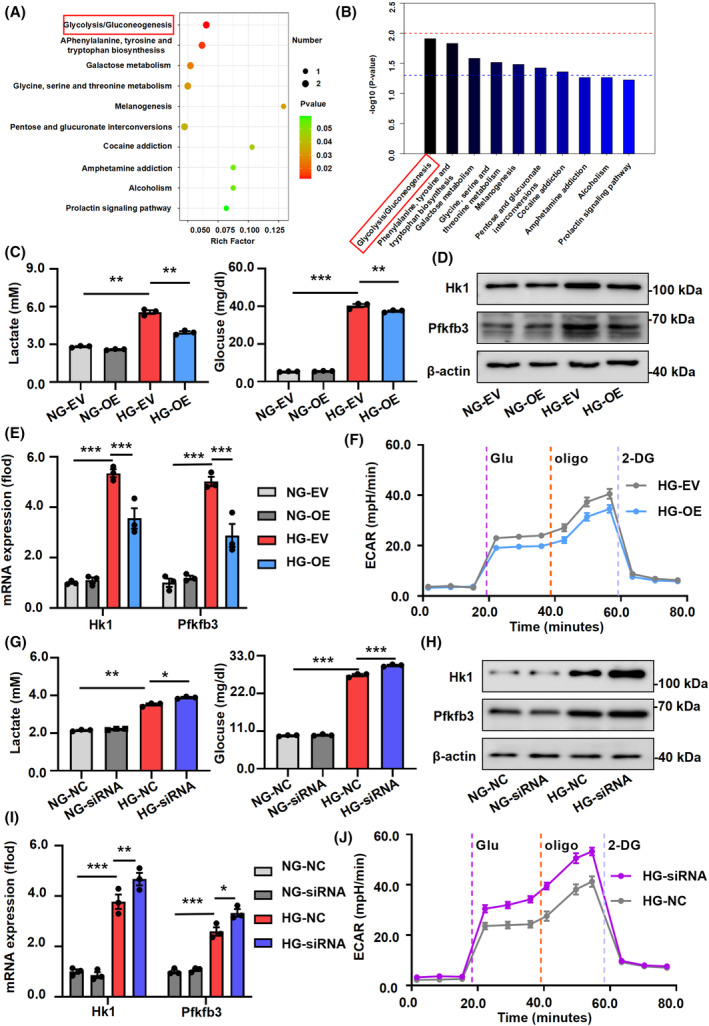
Overexpression of Fto decrease the glycolysis of HG‐stimulated macrophages. (A, B) Metabonomics sequencing of HG‐stimulated BMDMs following Fto overexpression, GO, and KEGG revealed enrichment of glycolysis‐related pathways. (C) The lactate production and glucose uptake were decreased in HG‐induced BMDMs after Fto was enhanced. (D, E) The protein and mRNA expression of glycolysis‐related markers Hk1 and Pfkfb3 were attenuated with overexpression of Fto. (F) Overexpression of Fto could effectively reduce the glycolysis level of HG‐stimulated BMDMs by using Seahorse analysis. (G) The lactate production and glucose uptake were increased in HG‐induced BMDMs after Fto suppressed. (H, I) The protein and mRNA expression of glycolysis‐related markers Hk1 and Pfkfb3 were enhanced with downexpression of Fto. (J) Downexpression of Fto could effectively enhanced the glycolysis level of HG‐stimulated BMDM by using Seahorse. The data represent the mean ± SEM. *p < .05, **p < .01, ***p < .001 versus db/m and HG‐EV group (C and E) and HG‐NC group (G and I).
3.4. Enhance the Fto expression in vivo significantly reduces kidney injury in db/db mice
Transmission electron microscopy revealed that the renal basement membrane thickness and foot process fusion degree were significantly elevated in db/db‐EV mice compared to db/dm‐EV mice. The degree of kidney injury, however, was significantly attenuated following Fto overexpression. PAS and HE staining revealed that Fto overexpression effectively mitigated mesangial expansion and tubulointerstitial damage in db/db‐EV mice. Immunohistochemistry results further demonstrated a reduction in the presence of F4/80+ inflammatory infiltration upon Fto overexpression (Figure 4A). Furthermore, the 24‐h urinary albumin excretion rate of db/db‐EV mice was decreased after enhancing Fto expression, and there was no significant difference in blood glucose (Figure 4B). Furthermore, primary kidney macrophages were isolated and assessed for efficient overexpression of Fto (Figure 4C). The administration of Fto overexpression resulted in a reduction in the release of Il‐1β, Tnf‐α, and Mcp‐1 (Figure 4D). Moreover, the results revealed a decrease in the expression of Il‐1β, Tnf‐α, and Mcp‐1 upon overexpression of Fto in primary macrophages (Figure S6A). Overexpression of Fto resulted in a downregulation of iNOS expression and an upregulation of Arg1 expression (Figures 4E and S6B). The levels of Hk1 and Pfkfb3 were decreased upon Fto administration (Figures 4E and S6C). Immunofluorescence analysis revealed that Fto overexpression effectively attenuated F4/80 and Hk1 expression in db/db‐OE mice (Figure S6D). Previous studies have demonstrated that tubular dysfunction may partially account for the presence of microalbuminuria in early‐stage diabetic nephropathy. 25 Furthermore, renal tubular injury is frequently accompanied by inflammatory infiltration. 26 We co‐cultured mTECs with BMDMs medium supernatant that was transfected with Fto overexpression (Figure 4F). Immunofluorescent staining revealed a reduction in F4/80 and Kim1 upon Fto administration (Figure 4G).
FIGURE 4.
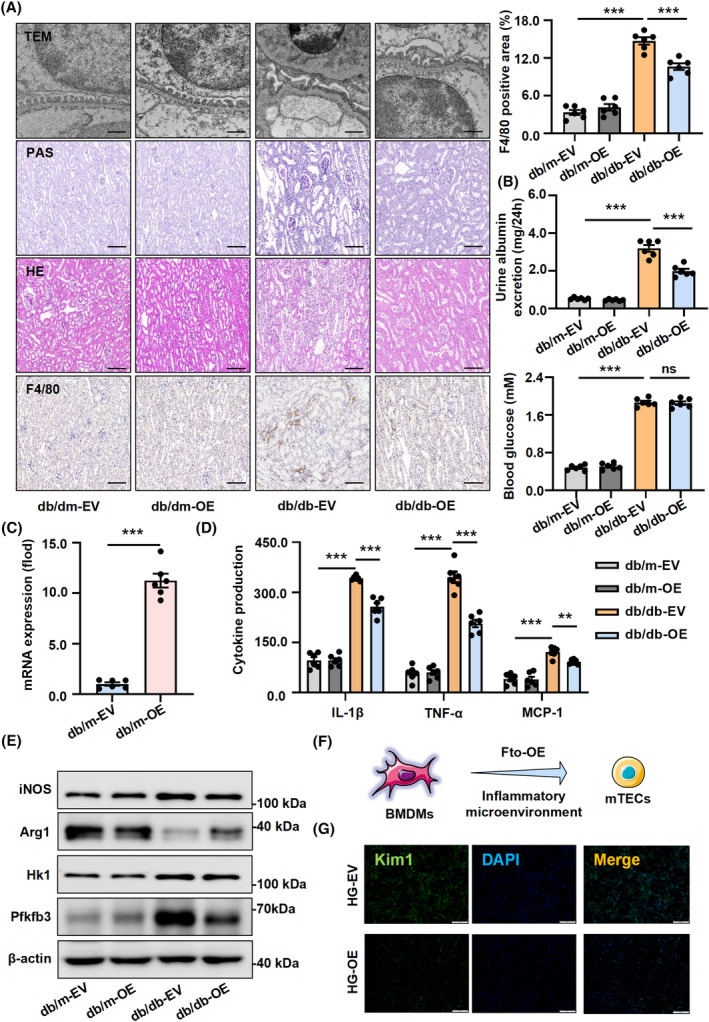
Enhance the Fto expression in vivo significantly reduces kidney injury in db/db mice. (A) Renal histopathological examination in db/db mice: Transmission electron microscopy (TEM) was used to analyze the representative micrographs and quantification of the average thickness of the glomerular basement membrane (GBM) and the average foot process width in db/db mice. Scale bars: 500 nm; PAS and HE staining showing typical glomerular structure changes in different groups of mice. Scale bars: 50 μm; IHC of F4/80 showed that Fto overexpression reduced the degree of inflammatory infiltration. Scale bars: 50 μm. (B) The 24‐h urinary albumin excretion rate of db/db‐EV mice was significantly higher than that of the db/m‐EV group, while decreased markedly after Fto expression was enhanced. And there was no significance in blood glucose. (C) The overexpression efficiency of Fto in primary Mφ. (D) The release of inflammatory factors and chemokines such as Il‐1β, Tnf‐α, and Mcp‐1 as shown by ELISA. (E) The protein expression levels of Il‐1β, Tnf‐α, Mcp‐1, iNOS, Arg1, Hk1, and Pfkfb3 from primary Mφ. (F) The schematic representation of mTECs and BMDMs co‐cultured. (G) Macrophage factors (F4/80), and renal tubular injury indicators (Kim1) were reduced following Fto administration by immunofluorescent staining. Scale bars: 50 μm. The data represent the mean ± SEM. **p < .01, ***p < .001 versus db/db‐EV (A, B, and D) and db/m‐EV group (C).
3.5. Fto‐mediated m6A modification of Npas2 mRNA maintains its Prrc2a‐dependent stability
Administration of Fto significantly reduced the level of m6A modification in HG‐stimulated BMDM (Figure 5A) and primary macrophages from db/db‐OE mice (Figure 5B). Furthermore, a reduction in the m6A methylation level was observed in db/db‐OE mice (Figure S7A). Methylated RNA immunoprecipitation sequencing (MeRIP‐seq) combined with RNA sequencing (RNA‐seq) in BMDMs subjected to either Fto overexpression or control conditions following HG stimulation (File S3). Notably, there were 11 overlapping transcripts between the RNA‐seq and epitranscriptomic microarray data (Figure 5C). We investigated the expression changes of these 11 differentially regulated genes in the presence of Fto overexpression (Figures 5D and S7B, and Supplemental File S4). There was a significant decrease in Npas2 expression levels upon Fto enhancement in HG‐stimulated BMDMs (Figure 5E). The expression of Npas2 in primary macrophages was found to be significantly reduced upon Fto overexpression (Figure 5F). Moreover, a negative correlation between the expression levels of Npas2 and Fto was observed in primary macrophages (Figure S7C). MeRIP‐qPCR results revealed a significant enrichment of Npas2 mRNA following HG‐stimulated BMDMs. However, in the presence of Fto overexpression, the m6A‐specific antibody led to a notable decrease in Npas2 mRNA enrichment (Figure 5G). According to the MeRIP‐seq analysis, m6A modifications were predominantly observed within a consensus motif “RRACH” (Figure S7D). Luciferase reporters containing either wild‐type or mutant Npas2 were constructed (Figure S7E). A significant decrease in the transcription level of wild‐type Npas2 with increasing Fto (Figure 5H).
FIGURE 5.
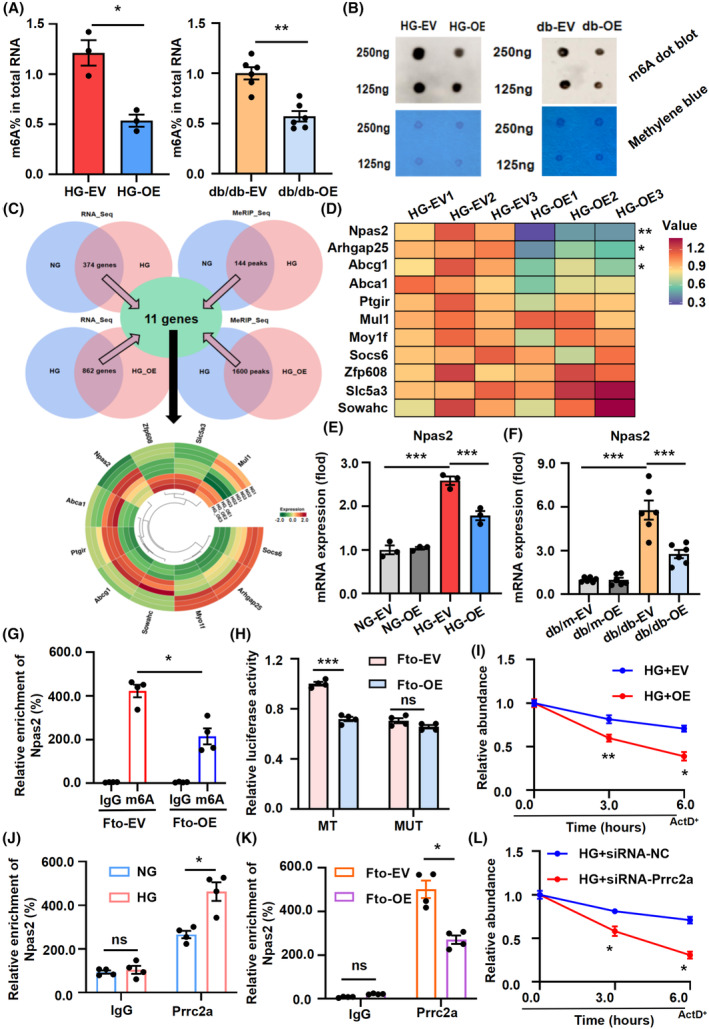
Fto‐mediated m6A modification of Npas2 mRNA maintains its Prrc2a‐dependent stability. (A, B) The level of m6A modification in HG‐stimulated BMDMs and primary Mφ following Fto administration by ELISA and dot blot. (C) RNA‐seq and mRNA epitranscriptomic array (m6A) in BMDMs with or without Fto overexpression stimulated by HG were performed with intersection analysis. (D) The heat map showed the mRNA expression changes of differential genes. (E, F) The mRNA expression of Npas2 in HG‐stimulated BMDMs and primary Mφ was decreased following Fto overexpression. (G) MeRIP‐qPCR analysis was employed to demonstrate Fto‐mediated Npas2 m6A modifications. The m6A modification of Npas2 was decreased when Fto overexpression. (H) The transcriptional level of wild‐type Npas2, but not the mutation, significantly decreased in Fto overexpression cells by luciferase reporter assay. (I) The levels of Npas2 expression in Fto overexpression and their corresponding control cells treated with actinomycin D (5 mg/mL) at indicated time points were detected by qRT‐PCR. (J) RIP‐qPCR analysis was employed to demonstrate the combination of Npas2 and Prrc2a. (K) Prrc2a‐specific antibody and IgG control antibody were used to detect the enrichment of Prrc2a‐binding Npas2 m6A modification sites using RIP‐qPCR. (L) The levels of Npas2 expression in Prrc2a downexpression and their corresponding control cells treated with actinomycin D (5 mg/mL) at indicated time points were detected by qRT‐PCR. The data represent the mean ± SEM. *p < .05, **p < .01, ***p < .001 versus HG‐EV (E and I), db/db‐EV group (D), Fto‐EV (m6A) group (G, H, and K), Prrc2a (NG) group (J), and HG + siRNA‐NC group (L).
Considering the regulatory role of m6A in target gene expression through modulation of their stability, our findings demonstrate that Fto enhancement significantly reduces Npas2 stability upon HG stimulation (Figure 5I). Therefore, to explore the reading proteins that play a role in m6A methylation, we have identified multiple single nucleotide polymorphisms (SNPs) associated with DN using genome‐wide association studies (GWAS). In this study, we used SMR to assess the potential causal association between m6A reader‐related genes and DN by using the two eQTL databases. 27 , 28 , 29 Our results showed that the stability‐associated reading protein Proline rich coiled‐coil 2 A (Prrc2a) 30 , 31 , 32 was identified as a risk factor and played an important role in the course of DN (Supplemental File S5, Figure S8A,B). RNA immunoprecipitation (RIP) analysis confirmed the binding ability of Prrc2a to Npas2 (Figure 5J). The Npas2 protein was significantly enriched in the HG‐EV group; however, this enrichment was noticeably reduced upon Fto overexpression in the HG‐OE group (Figure 5K). Moreover, silencing Prrc2a effectively decreased Npas2 expression in BMDMs stimulated with HG conditions (Figure S8C). Downregulation of Prrc2a resulted in reduced Npas2 stability (Figure 5L).
3.6. Regulation of macrophage inflammation and glycolysis through Npas2‐mediated HIF‐1α signaling pathway‐dependent pathways by Fto
In addition, Npas2 silencing effectively reduced kidney damage in a db/db mouse model of diabetic nephropathy. Electron microscope results showed that, compared with the model group, silencing Npas2 could effectively inhibit basement membrane thickening and foot process fusion. PAS and HE staining revealed that Npas2 downexpression effectively mitigated mesangial expansion and tubulointerstitial injury in db/db‐NC mice. Immunohistochemistry results further demonstrated a reduction in the presence of F4/80+ inflammatory infiltration upon Npas2 downexpression (Figure S9A). The 24‐h urinary albumin excretion rate of db/db‐NC mice was decreased after suppressing Npas2 expression (Figure S9B). Furthermore, primary kidney macrophages were isolated and assessed for efficient suppression of Npas2 (Figure S9C). The administration of Npas2 downexpression resulted in a reduction in the release of Il‐1β, Tnf‐α, and Mcp‐1 (Figure S9D). Moreover, the results revealed a decrease in the expression of Il‐1β, Tnf‐α, Mcp‐1, Hk1, Pfkfb3, and iNOS upon downexpression of Npas2 in primary macrophages (Figure S9E). Knockdown of Npas2 resulted in a significant reduction in the expression levels of Il‐1β, Tnf‐α, and Mcp‐1 (Figure S10A). Suppression of Npas2 led to a decrease in lactate production and glucose uptake (Figure S10B). The expression of Npas2 exhibited a positive correlation with Hk1 and Pfkfb3 in primary macrophages (Figure S10C). Downregulation of Npas2 resulted in a reduction in glycolytic capacity (ECAR) (Figure S10D). Furthermore, co‐inhibition of siRNA‐Npas2 and siRNA‐Fto significantly reduced the mRNA and protein levels of Il‐1β, Tnf‐α, Mcp‐1, and iNOS, as well as Hk1 and Pfkfb3 in HG‐stimulated BMDMs (Figures 6A and S11A,B). Co‐transfection of siRNA‐Fto and siRNA‐Npas2 effectively counteracted the upregulation of lactate production and glucose uptake induced by siRNA‐Fto (Figure 6B). Silencing Fto and Npas2 significantly attenuated the enhanced glycolytic capacity (ECAR) in HG‐stimulated BMDMs resulting from Fto knockdown (Figure 6C). A recent study has demonstrated that Hif1α is a direct transcriptional target of Npas2, which mediates the upregulation of glycolytic genes in disease. 33 Our findings revealed a negative correlation between Fto expression and Hif‐1α, while a positive correlation was observed between Npas2 and Hif‐1α in primary macrophages (Figure 6D). Moreover, co‐transfection of siRNA‐Fto and siRNA‐Npas2 effectively counteracted the upregulation of Hif‐1α mRNA and protein expression induced by siRNA‐Fto (Figure 6E,F). Immunofluorescence analysis revealed that Fto overexpression significantly attenuated Hif‐1α expression in kidney tissue of db/db mice (Figure 6G).
FIGURE 6.
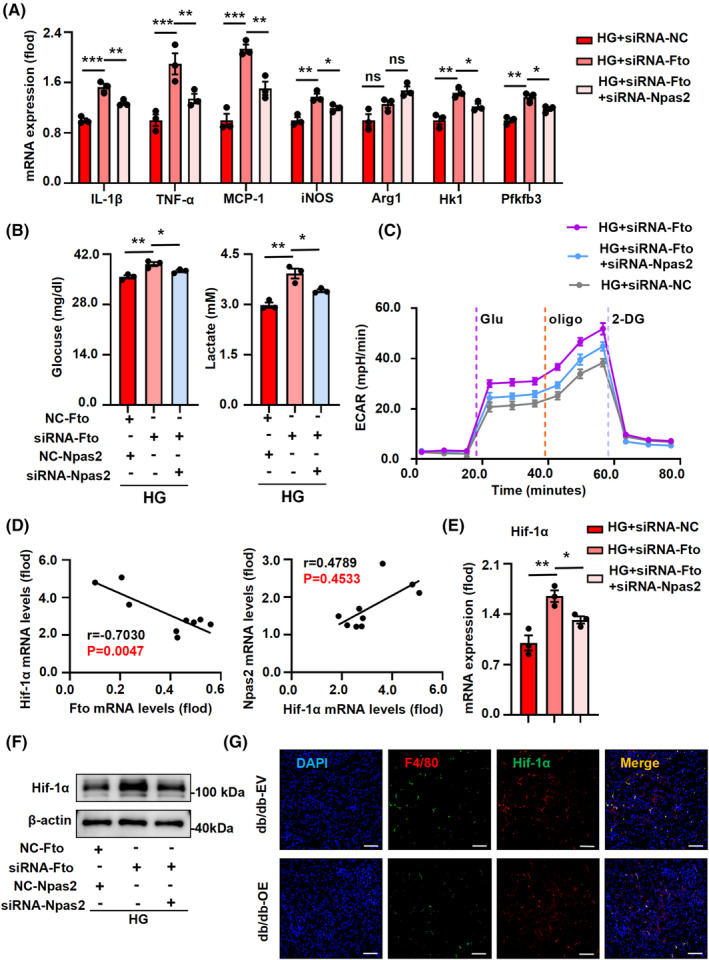
Regulation of macrophage inflammation and glycolysis through Npas2‐mediated Hif‐1α signaling pathway‐dependent pathways by Fto. (A) Co‐inhibition of siRNA‐Npas2 and siRNA‐Fto attenuated mRNA levels of indicators related to inflammatory responses (Il‐1β, Tnf‐α, and Mcp‐1), macrophage activation (iNOS), and glycolytic responses (Hk1 and Pfkfb3) in HG‐stimulated BMDMs. (B) Co‐transfection of siRNA‐Fto and siRNA‐Npas2 could effectively resist the increase of lactate production and glucose uptake induced by siRNA‐Fto. (C) Silencing Fto and Npas2 effectively reduced the increase of glycolytic capacity in HG‐stimulated BMDMs caused by silencing Fto. (D) The expression of Hif‐1α was negatively correlated with Fto and positively correlated with Npas2 in primary Mφ. (E, F) Co‐transfection of siRNA‐Fto and siRNA‐Npas2 could effectively resist the increase of Hif‐1α mRNA and protein expression. (G) Overexpression of Fto could effectively reduce the expression of Hif‐1α in kidney tissue of db/db‐EV mice by immunofluorescence. Representative images were presented; scale bar, 20 μm. The data represent the mean ± SEM. *p < .05, **p < .01, ***p < .001 versus HG + siRNA‐Fto group.
4. DISCUSSION AND CONCLUSION
Macrophage activation is a pathological hallmark of DN and M1‐activated macrophages playing a pivotal role in the initiation and progression of DN. 34 Our findings demonstrate that Fto overexpression significantly attenuates the production of inflammatory cytokines and chemokines in HG‐induced BMDMs, as evidenced by mRNA and protein expression analysis. Subsequently, the overexpression of Fto effectively attenuated the population of pro‐inflammatory M1 macrophage activation while promoting an increase in anti‐inflammatory M2 macrophages, and consistent findings were observed in db/db mice with elevated Fto expression.
Among the principal metabolic pathways fueling cellular processes, glycolysis stands out as a multifaceted enzymatic cascade. 35 Recently, studies have revealed that aerobic glycolysis plays a pivotal role in the regulation of macrophage polarization and immune function, thus serving as a metabolic hallmark for pro‐inflammatory macrophage activation. 36 , 37 In this study, M1‐activated macrophages stimulated by HG exhibited a higher lactate production compared to those with Fto overexpression, suggesting that Fto influenced the glycolysis during the polarization of macrophages. Furthermore, the overexpression of Fto significantly attenuated the glycolytic capacity (ECAR) of macrophages, whereas knockdown of Fto exerted the opposite effect.
Previous study discover that the metabolites and gene products present in M1‐activated macrophages can expedite the expression of pro‐inflammatory genes, thereby influencing bidirectional communication and paracrine signaling. To this end, we investigated the impact of HG‐induced secretion of inflammatory cytokines and chemokines by macrophages on mTECs. Our founding discovered that upregulation of Fto expression in macrophages effectively mitigated injury to renal tubular epithelial cells. Collectively, these findings suggest that Fto exerts an inhibitory effect on the polarization of macrophages toward the M1 phenotype by attenuating aerobic glycolysis capacity and modulating the secretion of inflammatory factors and chemokines. Moreover, it mitigates renal tubular epithelial cell injury, thereby ameliorating the progression of DN.
The m6A modification was initially discovered in the 1970s, and subsequent advancements in RNA sequencing techniques have facilitated the elucidation of its underlying mechanisms. 38 Furthermore, m6A methylation also governs the metabolic reprogramming of macrophages and actively participates in the pathogenesis of diseases. 19 First, we observed a significant increase in the m6A methylation level in HG‐stimulated BMDMs. Recently, RNA m6A modification has emerged as a prominent research focus in the field of diabetic regulation due to its involvement in diverse cellular processes including protein translation, molecular structure conversion, and mRNA maturation. 39 In this study, we investigated the expression of m6A methyltransferases (Wilms tumor 1‐associated protein/Methyltransferase‐like 14/Methyltransferase‐like 3) (Wtap/Mettl14/Mettl3) and demethylases (AlkB homolog 5) (Fto/Alkbh5) in HG‐stimulated macrophages and observed a significant downregulation of Fto expression. Subsequently, kidney macrophages isolated from db/db mice were utilized to validate the in vivo expression of Fto. Furthermore, our findings suggest that the downregulation of Fto is concomitant with the deterioration of general indicators associated with DN. Furthermore, MeRIP‐seq and RNA‐seq analyses were conducted to further investigate the role of Fto to ascertain whether Npas2 is a downstream target of m6A modification. The negative regulation of Npas2 by Fto and its modification by Fto‐mediated m6A demethylase were confirmed through MeRIP‐qPCR and luciferase reporter assays. The mRNA transcripts with m6A modification are targeted by various m6A readers, potentially leading to divergent outcomes. Our study demonstrated that the overexpression of Fto resulted in a decrease in the stability of Npas2 under HG‐stimulated conditions in BMDMs. Furthermore, our results have highlighted Prrc2a as a particularly intriguing stabilizing reading protein was played an important role in the course of DN. Prrc2a exerts its regulatory role by modulating the mRNA stability of target genes. 31 The results demonstrated that efficient silencing of Prrc2a significantly compromised the stability of Npas2. This study provides evidence for the crucial role of Prrc2a in regulating Npas2 mRNA stability under the control of Fto in macrophages. Simultaneously, studies have also revealed that the upregulation of Npas2 induced by HG contributes to the pathogenesis of DN; however, the underlying mechanism remains unclear. In our current investigation, we demonstrated an augmented expression of Npas2 in DN macrophages, thereby exacerbating inflammation and glycolysis. Suppression of Npas2 significantly attenuates the secretion of inflammatory factors and chemokines, leading to a pronounced reduction in glycolytic activity. Additionally, our findings suggest that Npas2 may modulate Hif‐1α as a potential therapeutic target for mitigating inflammation and glycolysis in DN. Silencing Npas2 significantly attenuates Hif‐1α expression, thereby mitigating macrophage activation induced by HG.
In conclusion, our findings demonstrate that Fto exhibits low expression in type 2 DN and reduces the m6A modification level of Npas2 in macrophages through a Prrc2a‐dependent mechanism, and decreasing its stability. This process mediates inflammation and glycolysis in M1 macrophage activation by regulating the Hif‐1α signaling pathway (Figure 7). The findings of our study unveil a novel pathogenic mechanism underlying DN and provide a new road for exploring promising therapeutic strategies against this condition. However, the intercellular communication between macrophages and mTECS during the experiment attracted our attention. This study only briefly explored the effect of inflammatory factors and chemokines secreted by macrophages on the production of mTECs, and the mechanism was not further studied. Therefore, in the course of the later experiment, this part is worth us to explore.
FIGURE 7.

Fto could reshape m6A methylation level in macrophages, and cooperate with reading protein Prrc2a reduces Npas2 stability, combining Hif‐1α reduce M1 macrophages in the inflammatory and glycolysis, through the m6A/Npas2/Hif‐1α axis to participate in the process of DN.
AUTHOR CONTRIBUTIONS
Yonggui Wu and Xueqi Liu: Conceptualization, planning, visualization, supervision, review, and editing. Sai Zhu, Ling Jiang, Xinran Liu and Chaoyi Chen: Investigation, formal analysis, writing original draft. Xiaomei Luo, Shan Jiang and Jiuyu Yin: Methodology, investigation, formal analysis. All authors contributed to the article and approved the submitted version.
DISCLOSURES
The authors declare no competing interests.
ETHICS STATEMENT
The clinical information was obtained with informed consent from patients and conducted by the Declaration of Helsinki. It received approval from the Research Ethics Committee of the First Affiliated Hospital of Anhui Medical University (No. 2022084). The animal experiments were conducted in the specific pathogen‐free (SPF) animal laboratory at Anhui Medical University and received approval from the Ethics Committee for Animal Research at Anhui Medical University (No. 20220091).
Supporting information
Figure S1. (A) Electron microscopy demonstrating the ultrastructural changes in db/db mice (scale bar, 500 nm), and pathology observation of db/db mice kidney tissues sections stained with PAS, H&E, and IHC of F4/80 (scale bar, 50 μm). (B) Biochemical measurements of db/db mice, including serum creatinine, blood urea nitrogen, and 24 h urinary albumin levels. (C) Injury markers (Kim1, Il‐1β, Tnf‐α, Mcp‐1) were detected in db/m and db/db mice by qRT‐pcr. Representative images were presented. The data represent the mean ± SEM. *p < .05, **p < .01, ***p < .001 versus db/m group.
Figure S2. (A) Expression of RNA m6A methylation‐regulated associated genes in db/db diabetic mice was detected by western blot. (B) The results of RNA‐seq in HG‐stimulated BMDMs. (C) The expression of Fto was negatively correlated with Mcp‐1 in primary Mφ by qRT‐pcr. (D) Fto was correlated with creatinine, urea nitrogen, and 24 h urinary albumin levels in F4/80+ macrophages of db/db mice. The data represent the mean ± SEM. *p < .05, **p < .01, ***p < .001 versus NG group.
Figure S3. (A) The silencing and overexpression efficiency of Fto in BMDMs. (B) Increased mRNA expression of Il‐1β, Tnf‐α, Mcp‐1, iNOS, Arg1, and Il‐10 in HG‐stimulated BMDMs. (C) The expression of Fto was positively correlated with Arg1 in primary Mφ by qRT‐RCR. The data represent the mean ± SEM. *p < .05, **p < .01, ***p < .001 versus Fto‐EV group (A), siRNA‐NC group (A), and NG group (B).
Figure S4. (A) Fto overexpression decreased the mRNA expression of Il‐1β, Tnf‐α, and Mcp‐1. (B) Increasing the expression of Fto increased the mRNA expression of Arg1 in HG‐stimulated BMDMs. (C) The protein expression of iNOS and Arg1 in HG‐stimulated BMDMs following Fto overexpression. (D) Fto suppression enhanced the mRNA expression of Il‐1β, Tnf‐α, and Mcp‐1. (E) The mRNA expression of Arg1 in HG‐stimulated BMDMs was no significant influence. (F) The protein expression of iNOS and Arg1 in HG‐stimulated BMDMs following Fto downexpression. The data represent the mean ± SEM. *p < .05, **p < .01, ***p < .001 vs. HG‐EV group (A, B) and HG‐NC group (D, E, F).
Figure S5. (A) Lactate production and glucose uptake in HG‐stimulated BMDMs. (B, C) mRNA expression of Hk1 and Pfkfb3 in HG‐stimulated BMDMs and db/db mice. (D) The expression of Fto was negatively correlated with Hk1 and Pfkfb3 in primary Mφ by qRT‐PCR. The data represent the mean ± SEM. *p < .05, **p < .01, ***p < .001 versus NG group (A, B) and db/m group (C).
Figure S6. (A–C) The mRNA expression of Il‐1β, Tnf‐α, Mcp‐1, iNOS, Arg1, Hk1, and Pfkfb3 was decreased following Fto overexpression in primary Mφ. (D) Overexpression of Fto effectively reduced F4/80 and Hk1 expression in kidney tissue of db/db mice by immunofluorescence. Representative images were presented; scale bar, 20 μm. The data represent the mean ± SEM. *p < .05, **p < .01, ***p < .001 versus db/db‐EV group.
Figure S7. (A) Overexpression of Fto also reduced the m6A methylation level in kidney tissues of db/db mice. (B) the mRNA expression changes of differential genes. (C) The expression of Fto was negatively correlated with Npas2 in primary Mφ by qRT‐PCR. (D) Predominant consensus motif “RRACH” was detected in HG‐stimulated BMDM with and without Fto in MeRIP‐seq. (E) The wild‐type or mutant Npas2‐5′UTR fused with the luciferase reporter, respectively. The data represent the mean ± SEM. *p < .05, **p < .01, ***p < .001 versus HG‐EV (B).
Figure S8. (A) The expression levels of the Prrc2a gene in GTEx V8_Whole_blood were associated with DN. (B) The expression levels of the Prrc2a gene in GTEx V8_Whole_blood were associated with DN. (C) Silencing Prrc2a was able to effectively reduce Npas2 expression in HG‐stimulated BMDMs. The data represent the mean ± SEM. *p < .05, **p < .01, ***p < .001 versus HG‐NC group.
Figure S9. (A) Renal histopathological examination in db/db‐NC mice: Transmission electron microscopy (TEM) was used to analyze the representative micrographs and quantification of the average thickness of the glomerular basement membrane (GBM) and the average foot process width in db/db‐NC mice. Scale bars: 500 nm; PAS and HE staining showing typical glomerular structure changes in different groups of mice. Scale bars: 50 μm; IHC of F4/80 showed that Npas2 downexpression reduced the degree of inflammatory infiltration. Scale bars: 50 μm. (B) The 24 h urinary albumin excretion rate and blood glucose of db/db mice after Npas2 knockdown. (C) The downexpression efficiency of Npas2 in primary Mφ. (D) The release of inflammatory factors and chemokines such as Il1b, Tnfa, and Mcp‐1 as shown by ELISA. (E) The mRNA expression of Il‐1β, Tnf‐α, Mcp‐1, iNOS, Arg1, Hk1, and Pfkfb3 was decreased following Npas2 suppression in primary Mφ. The data represent the mean ± SEM. *p < .05, **p < .01, ***p < .001 versus db/db‐NC group.
Figure S10. (A) Knockdown of Npas2 significantly decreased the expression of inflammation factors Il‐1β, Tnf‐α, and Mcp‐1 by ELISA. (B) The lactate production and glucose uptake were alleviated following Npas2 suppression. (C) The expression of Npas2 was positively correlated with Hk1 and Pfkfb3 in primary Mφ. (D) Downexpression of Npas2 reduced glycolytic capacity by seahorse analysis following HG stimulation. The data represent the mean ± SEM. *p < .05, **p < .01, ***p < .001 versus HG‐NC group.
Figure S11. (A) Co‐inhibition of siRNA‐Npas2 and siRNA‐Fto attenuated release of indicators related to inflammatory responses (Il‐1β, Tnf‐α, and Mcp‐1) by ELISA. (B) Co‐inhibition of siRNA‐Npas2 and siRNA‐Fto attenuated protein levels of indicators related to iNOS, Hk1, and Pfkfb3 in HG‐stimulated BMDMs. The data represent the mean ± SEM. *p < .05, **p < .01, ***p < .001 versus HG + siRNA‐Fto group.
Table S1. Primers sequences used for qRT‐PCR.
TABLE S2. Oligo sequence in this study.
Dataset S1.
Dataset S2.
ACKNOWLEDGMENTS
This work was supported by the National Science Foundation of China (No. 82270765); the National Natural Science Foundation of China (No. 82200806); Basic and Clinical Improvement Program of Anhui Medical University (2023xkjT034); 2022 Anhui Provincial Department of Education University research project (2022AH051180). Conflicts of interest statement the authors declare that they have no competing interests.
Zhu S, Jiang L, Liu X, et al. m6A demethylase Fto inhibited macrophage activation and glycolysis in diabetic nephropathy via m6A/Npas2/Hif‐1α axis. The FASEB Journal. 2025;39:e70332. doi: 10.1096/fj.202403014R
Sai Zhu, Ling Jiang, Xinran Liu and Chaoyi Chen contributed equally to this work.
Contributor Information
Xueqi Liu, Email: liuxueqi@ahmu.edu.cn.
Yonggui Wu, Email: wuyonggui@medmail.com.cn.
DATA AVAILABILITY STATEMENT
All the data had been included in the manuscript for checking, and the original raw data could be obtained from the corresponding author with reasonable request.
REFERENCES
- 1. Jiang WJ, Xu CT, Du CL, et al. Tubular epithelial cell‐to‐macrophage communication forms a negative feedback loop via extracellular vesicle transfer to promote renal inflammation and apoptosis in diabetic nephropathy. Theranostics. 2022;12(1):324‐339. [DOI] [PMC free article] [PubMed] [Google Scholar]
- 2. Du L, Chen YB, Shi JS, et al. Inhibition of S100A8/A9 ameliorates renal interstitial fibrosis in diabetic nephropathy. Metabolism. 2023;144:155376. [DOI] [PubMed] [Google Scholar]
- 3. Fineberg D, Jandeleit‐Dahm KA, Cooper ME. Diabetic nephropathy: diagnosis and treatment. Nat Rev Endocrinol. 2013;9(12):713‐723. [DOI] [PubMed] [Google Scholar]
- 4. Wang X, Yao B, Wang Y, et al. Macrophage Cyclooxygenase‐2 protects against development of diabetic nephropathy. Diabetes. 2017;66(2):494‐504. [DOI] [PMC free article] [PubMed] [Google Scholar]
- 5. Han X, Wei J, Zheng R, et al. Macrophage SHP2 deficiency alleviates diabetic nephropathy via suppression of MAPK/NF‐kappaB‐ dependent inflammation. Diabetes. 2024;73(5):780‐796. [DOI] [PubMed] [Google Scholar]
- 6. Liu JL, Zhang L, Huang Y, et al. Epsin1‐mediated exosomal sorting of Dll4 modulates the tubular‐macrophage crosstalk in diabetic nephropathy. Mol Ther. 2023;31(5):1451‐1467. [DOI] [PMC free article] [PubMed] [Google Scholar]
- 7. Jing C, Castro‐Dopico T, Richoz N, et al. Macrophage metabolic reprogramming presents a therapeutic target in lupus nephritis. Proc Natl Acad Sci USA. 2020;117(26):15160‐15171. [DOI] [PMC free article] [PubMed] [Google Scholar]
- 8. O'Neill LA, Pearce EJ. Immunometabolism governs dendritic cell and macrophage function. J Exp Med. 2016;213(1):15‐23. [DOI] [PMC free article] [PubMed] [Google Scholar]
- 9. Bantug GR, Galluzzi L, Kroemer G, Hess C. The spectrum of T cell metabolism in health and disease. Nat Rev Immunol. 2018;18(1):19‐34. [DOI] [PubMed] [Google Scholar]
- 10. Yu W, Zhang X, Wu H, et al. HO‐1 is essential for tetrahydroxystilbene glucoside mediated mitochondrial biogenesis and anti‐inflammation process in LPS‐treated RAW264.7 macrophages. Oxidative Med Cell Longev. 2017;2017:1818575. [DOI] [PMC free article] [PubMed] [Google Scholar]
- 11. Darshi M, Kugathasan L, Maity S, et al. Glycolytic lactate in diabetic kidney disease. JCI Insight. 2024;9(11):e168825. [DOI] [PMC free article] [PubMed] [Google Scholar]
- 12. Fu Y, Dominissini D, Rechavi G, He C. Gene expression regulation mediated through reversible m6A RNA methylation. Nat Rev Genet. 2014;15(5):293‐306. [DOI] [PubMed] [Google Scholar]
- 13. Sun L, Chen X, Zhu S, et al. Decoding m(6)a mRNA methylation by reader proteins in liver diseases. Genes Dis. 2024;11(2):711‐726. [DOI] [PMC free article] [PubMed] [Google Scholar]
- 14. Wang JN, Wang F, Ke J, et al. Inhibition of METTL3 attenuates renal injury and inflammation by alleviating TAB3 m6A modifications via IGF2BP2‐dependent mechanisms. Sci Transl Med. 2022;14(640):eabk2709. [DOI] [PubMed] [Google Scholar]
- 15. Wang T, Kong S, Tao M, Ju S. The potential role of RNA N6‐methyladenosine in cancer progression. Mol Cancer. 2020;19(1):88. [DOI] [PMC free article] [PubMed] [Google Scholar]
- 16. Jiang L, Liu X, Hu X, et al. METTL3‐mediated m(6)a modification of TIMP2 mRNA promotes podocyte injury in diabetic nephropathy. Mol Ther. 2022;30(4):1721‐1740. [DOI] [PMC free article] [PubMed] [Google Scholar]
- 17. Yu J, Chai P, Xie M, et al. Histone lactylation drives oncogenesis by facilitating m(6)a reader protein YTHDF2 expression in ocular melanoma. Genome Biol. 2021;22(1):85. [DOI] [PMC free article] [PubMed] [Google Scholar]
- 18. Liu Y, Shi M, He X, et al. LncRNA‐PACERR induces pro‐tumour macrophages via interacting with miR‐671‐3p and m6A‐reader IGF2BP2 in pancreatic ductal adenocarcinoma. J Hematol Oncol. 2022;15(1):52. [DOI] [PMC free article] [PubMed] [Google Scholar]
- 19. Yin H, Zhang X, Yang P, et al. RNA m6A methylation orchestrates cancer growth and metastasis via macrophage reprogramming. Nat Commun. 2021;12(1):1394. [DOI] [PMC free article] [PubMed] [Google Scholar]
- 20. Yang H, Xie T, Li D, et al. Tim‐3 aggravates podocyte injury in diabetic nephropathy by promoting macrophage activation via the NF‐kappaB/TNF‐alpha pathway. Mol Metab. 2019;23:24‐36. [DOI] [PMC free article] [PubMed] [Google Scholar]
- 21. Starkey Lewis P, Campana L, Aleksieva N, et al. Alternatively activated macrophages promote resolution of necrosis following acute liver injury. J Hepatol. 2020;73(2):349‐360. [DOI] [PMC free article] [PubMed] [Google Scholar]
- 22. Chen X, Li HD, Bu FT, et al. Circular RNA circFBXW4 suppresses hepatic fibrosis via targeting the miR‐18b‐3p/FBXW7 axis. Theranostics. 2020;10(11):4851‐4870. [DOI] [PMC free article] [PubMed] [Google Scholar]
- 23. Zhu S, Chen X, Wang JN, et al. Circular RNA circUbe2k promotes hepatic fibrosis via sponging miR‐149‐5p/TGF‐beta2 axis. FASEB J. 2021;35(6):e21622. [DOI] [PMC free article] [PubMed] [Google Scholar]
- 24. Sun LJ, Chen X, Zhu S, et al. Hesperetin derivative 2a inhibits lipopolysaccharide‐induced acute liver injury in mice via downregulation of circDcbld2. Acta Pharmacol Sin. 2024;45(2):354‐365. [DOI] [PMC free article] [PubMed] [Google Scholar]
- 25. Tojo A, Onozato ML, Ha H, et al. Reduced albumin reabsorption in the proximal tubule of early‐stage diabetic rats. Histochem Cell Biol. 2001;116(3):269‐276. [DOI] [PubMed] [Google Scholar]
- 26. Bohle A, Wehrmann M, Bogenschutz O, Batz C, Muller CA, Muller GA. The pathogenesis of chronic renal failure in diabetic nephropathy. Investigation of 488 cases of diabetic glomerulosclerosis. Pathol Res Pract. 1991;187(2–3):251‐259. [DOI] [PubMed] [Google Scholar]
- 27. Zhu Z, Zhang F, Hu H, et al. Integration of summary data from GWAS and eQTL studies predicts complex trait gene targets. Nat Genet. 2016;48(5):481‐487. [DOI] [PubMed] [Google Scholar]
- 28. Vosa U, Claringbould A, Westra HJ, et al. Large‐scale cis‐ and trans‐eQTL analyses identify thousands of genetic loci and polygenic scores that regulate blood gene expression. Nat Genet. 2021;53(9):1300‐1310. [DOI] [PMC free article] [PubMed] [Google Scholar]
- 29. Consortium GT . The GTEx consortium atlas of genetic regulatory effects across human tissues. Science. 2020;369(6509):1318‐1330. [DOI] [PMC free article] [PubMed] [Google Scholar]
- 30. Wu R, Li A, Sun B, et al. A novel m(6)a reader Prrc2a controls oligodendroglial specification and myelination. Cell Res. 2019;29(1):23‐41. [DOI] [PMC free article] [PubMed] [Google Scholar]
- 31. Tan X, Zheng C, Zhuang Y, Jin P, Wang F. The m6A reader PRRC2A is essential for meiosis I completion during spermatogenesis. Nat Commun. 2023;14(1):1636. [DOI] [PMC free article] [PubMed] [Google Scholar]
- 32. Liu X, Zhang Y, Wang Z, et al. PRRC2A promotes hepatocellular carcinoma progression and associates with immune infiltration. J Hepatocell Carcinoma. 2021;8:1495‐1511. [DOI] [PMC free article] [PubMed] [Google Scholar]
- 33. Yuan P, Yang T, Mu J, et al. Circadian clock gene NPAS2 promotes reprogramming of glucose metabolism in hepatocellular carcinoma cells. Cancer Lett. 2020;469:498‐509. [DOI] [PubMed] [Google Scholar]
- 34. Kimball A, Schaller M, Joshi A, et al. Ly6C(hi) blood monocyte/macrophage drive chronic inflammation and impair wound healing in diabetes mellitus. Arterioscler Thromb Vasc Biol. 2018;38(5):1102‐1114. [DOI] [PMC free article] [PubMed] [Google Scholar]
- 35. Lunt SY, Vander Heiden MG. Aerobic glycolysis: meeting the metabolic requirements of cell proliferation. Annu Rev Cell Dev Biol. 2011;27:441‐464. [DOI] [PubMed] [Google Scholar]
- 36. Fukuzumi M, Shinomiya H, Shimizu Y, Ohishi K, Utsumi S. Endotoxin‐induced enhancement of glucose influx into murine peritoneal macrophages via GLUT1. Infect Immun. 1996;64(1):108‐112. [DOI] [PMC free article] [PubMed] [Google Scholar]
- 37. Freemerman AJ, Johnson AR, Sacks GN, et al. Metabolic reprogramming of macrophages: glucose transporter 1 (GLUT1)‐mediated glucose metabolism drives a proinflammatory phenotype. J Biol Chem. 2014;289(11):7884‐7896. [DOI] [PMC free article] [PubMed] [Google Scholar]
- 38. Liu J, Jia G. Methylation modifications in eukaryotic messenger RNA. J Genet Genomics. 2014;41(1):21‐33. [DOI] [PubMed] [Google Scholar]
- 39. Lu Z, Liu H, Song N, et al. METTL14 aggravates podocyte injury and glomerulopathy progression through N(6)‐methyladenosine‐dependent downregulating of Sirt1. Cell Death Dis. 2021;12(10):881. [DOI] [PMC free article] [PubMed] [Google Scholar]
Associated Data
This section collects any data citations, data availability statements, or supplementary materials included in this article.
Supplementary Materials
Figure S1. (A) Electron microscopy demonstrating the ultrastructural changes in db/db mice (scale bar, 500 nm), and pathology observation of db/db mice kidney tissues sections stained with PAS, H&E, and IHC of F4/80 (scale bar, 50 μm). (B) Biochemical measurements of db/db mice, including serum creatinine, blood urea nitrogen, and 24 h urinary albumin levels. (C) Injury markers (Kim1, Il‐1β, Tnf‐α, Mcp‐1) were detected in db/m and db/db mice by qRT‐pcr. Representative images were presented. The data represent the mean ± SEM. *p < .05, **p < .01, ***p < .001 versus db/m group.
Figure S2. (A) Expression of RNA m6A methylation‐regulated associated genes in db/db diabetic mice was detected by western blot. (B) The results of RNA‐seq in HG‐stimulated BMDMs. (C) The expression of Fto was negatively correlated with Mcp‐1 in primary Mφ by qRT‐pcr. (D) Fto was correlated with creatinine, urea nitrogen, and 24 h urinary albumin levels in F4/80+ macrophages of db/db mice. The data represent the mean ± SEM. *p < .05, **p < .01, ***p < .001 versus NG group.
Figure S3. (A) The silencing and overexpression efficiency of Fto in BMDMs. (B) Increased mRNA expression of Il‐1β, Tnf‐α, Mcp‐1, iNOS, Arg1, and Il‐10 in HG‐stimulated BMDMs. (C) The expression of Fto was positively correlated with Arg1 in primary Mφ by qRT‐RCR. The data represent the mean ± SEM. *p < .05, **p < .01, ***p < .001 versus Fto‐EV group (A), siRNA‐NC group (A), and NG group (B).
Figure S4. (A) Fto overexpression decreased the mRNA expression of Il‐1β, Tnf‐α, and Mcp‐1. (B) Increasing the expression of Fto increased the mRNA expression of Arg1 in HG‐stimulated BMDMs. (C) The protein expression of iNOS and Arg1 in HG‐stimulated BMDMs following Fto overexpression. (D) Fto suppression enhanced the mRNA expression of Il‐1β, Tnf‐α, and Mcp‐1. (E) The mRNA expression of Arg1 in HG‐stimulated BMDMs was no significant influence. (F) The protein expression of iNOS and Arg1 in HG‐stimulated BMDMs following Fto downexpression. The data represent the mean ± SEM. *p < .05, **p < .01, ***p < .001 vs. HG‐EV group (A, B) and HG‐NC group (D, E, F).
Figure S5. (A) Lactate production and glucose uptake in HG‐stimulated BMDMs. (B, C) mRNA expression of Hk1 and Pfkfb3 in HG‐stimulated BMDMs and db/db mice. (D) The expression of Fto was negatively correlated with Hk1 and Pfkfb3 in primary Mφ by qRT‐PCR. The data represent the mean ± SEM. *p < .05, **p < .01, ***p < .001 versus NG group (A, B) and db/m group (C).
Figure S6. (A–C) The mRNA expression of Il‐1β, Tnf‐α, Mcp‐1, iNOS, Arg1, Hk1, and Pfkfb3 was decreased following Fto overexpression in primary Mφ. (D) Overexpression of Fto effectively reduced F4/80 and Hk1 expression in kidney tissue of db/db mice by immunofluorescence. Representative images were presented; scale bar, 20 μm. The data represent the mean ± SEM. *p < .05, **p < .01, ***p < .001 versus db/db‐EV group.
Figure S7. (A) Overexpression of Fto also reduced the m6A methylation level in kidney tissues of db/db mice. (B) the mRNA expression changes of differential genes. (C) The expression of Fto was negatively correlated with Npas2 in primary Mφ by qRT‐PCR. (D) Predominant consensus motif “RRACH” was detected in HG‐stimulated BMDM with and without Fto in MeRIP‐seq. (E) The wild‐type or mutant Npas2‐5′UTR fused with the luciferase reporter, respectively. The data represent the mean ± SEM. *p < .05, **p < .01, ***p < .001 versus HG‐EV (B).
Figure S8. (A) The expression levels of the Prrc2a gene in GTEx V8_Whole_blood were associated with DN. (B) The expression levels of the Prrc2a gene in GTEx V8_Whole_blood were associated with DN. (C) Silencing Prrc2a was able to effectively reduce Npas2 expression in HG‐stimulated BMDMs. The data represent the mean ± SEM. *p < .05, **p < .01, ***p < .001 versus HG‐NC group.
Figure S9. (A) Renal histopathological examination in db/db‐NC mice: Transmission electron microscopy (TEM) was used to analyze the representative micrographs and quantification of the average thickness of the glomerular basement membrane (GBM) and the average foot process width in db/db‐NC mice. Scale bars: 500 nm; PAS and HE staining showing typical glomerular structure changes in different groups of mice. Scale bars: 50 μm; IHC of F4/80 showed that Npas2 downexpression reduced the degree of inflammatory infiltration. Scale bars: 50 μm. (B) The 24 h urinary albumin excretion rate and blood glucose of db/db mice after Npas2 knockdown. (C) The downexpression efficiency of Npas2 in primary Mφ. (D) The release of inflammatory factors and chemokines such as Il1b, Tnfa, and Mcp‐1 as shown by ELISA. (E) The mRNA expression of Il‐1β, Tnf‐α, Mcp‐1, iNOS, Arg1, Hk1, and Pfkfb3 was decreased following Npas2 suppression in primary Mφ. The data represent the mean ± SEM. *p < .05, **p < .01, ***p < .001 versus db/db‐NC group.
Figure S10. (A) Knockdown of Npas2 significantly decreased the expression of inflammation factors Il‐1β, Tnf‐α, and Mcp‐1 by ELISA. (B) The lactate production and glucose uptake were alleviated following Npas2 suppression. (C) The expression of Npas2 was positively correlated with Hk1 and Pfkfb3 in primary Mφ. (D) Downexpression of Npas2 reduced glycolytic capacity by seahorse analysis following HG stimulation. The data represent the mean ± SEM. *p < .05, **p < .01, ***p < .001 versus HG‐NC group.
Figure S11. (A) Co‐inhibition of siRNA‐Npas2 and siRNA‐Fto attenuated release of indicators related to inflammatory responses (Il‐1β, Tnf‐α, and Mcp‐1) by ELISA. (B) Co‐inhibition of siRNA‐Npas2 and siRNA‐Fto attenuated protein levels of indicators related to iNOS, Hk1, and Pfkfb3 in HG‐stimulated BMDMs. The data represent the mean ± SEM. *p < .05, **p < .01, ***p < .001 versus HG + siRNA‐Fto group.
Table S1. Primers sequences used for qRT‐PCR.
TABLE S2. Oligo sequence in this study.
Dataset S1.
Dataset S2.
Data Availability Statement
All the data had been included in the manuscript for checking, and the original raw data could be obtained from the corresponding author with reasonable request.