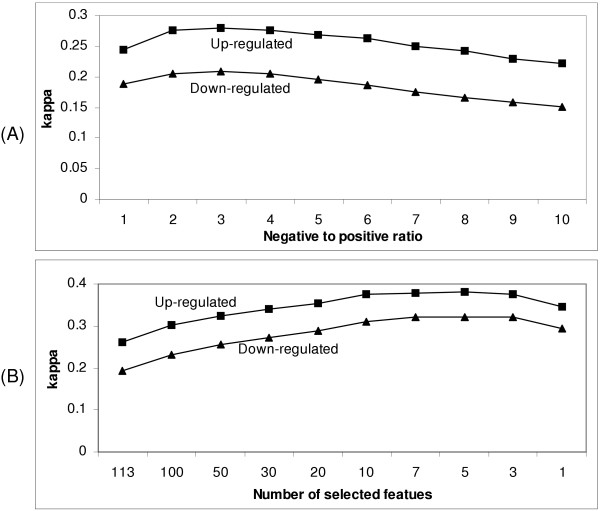
Figure 1.

Effects of class distribution and feature selection on the accuracies of models. Models were built with ChIP-chip data for up- and down-regulated genes in yeast cell cycle. Each data point is an average of the kappa values of 10 × 77 = 770 models. (A). Effects of class distribution. X-axis ratio of the number of negative instances to the number of positive instances; y-axis: kappa in ten-fold cross-validations; (B). Effects of feature selection. X-axis: number of features selected; y-axis: kappa in ten-fold cross-validations.
