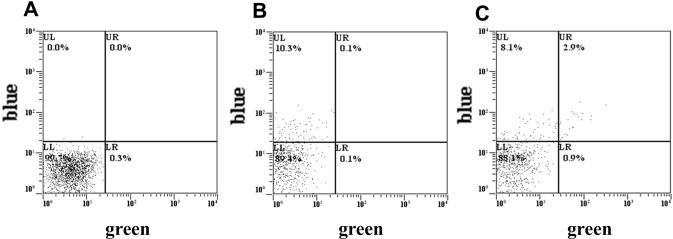
Figure 2.
Conversion of episomal eBFP to GFP. Representative dotplots of 293T cells 3 days after co-transfection with (A) pLacZ and 45-PS-eGFPas ON, (B) peBFP and 25-PS-PDEas ON and (C) peBFP and 45-PS-eGFPas ON as detailed in Materials and Methods. The control ON, 25-PS-PDEas, was of sequence complementary to βPDE. The control plasmid, pLacZ, was an expression vector for β-galactosidase. Blue fluorescent only cells are in the upper left quadrant (UL) and green and blue fluorescent cells, corresponding to converted cells, in the upper right (UR).

