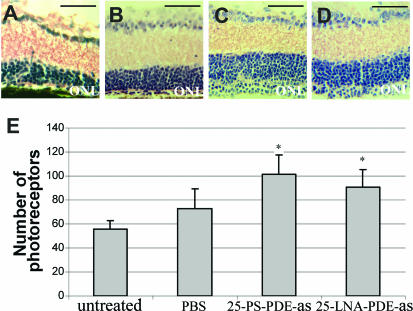
Figure 7.
Eye sections of control and treated rd1 mice at PN28 and photoreceptor cell numbers in the outer nuclear layer (ONL). Hematoxylin–eosin stained sections of eyes of (A) untreated, (B) PBS-treated, (C) 25-PS-PDEas ON-treated and (D) 25-LNA-PDEas ON-treated rd1 mice. A and B are representative of the entire ONL of the corresponding retinas, whereas (C and D) are selected are as showing markedly increased cell numbers in the ONL of ON-treated rd1 mice. Scale bars: 100 μm. (E) Counting of cells in the ONL showed a modest but significant overall increase of cells in 25-PS-PDEas or 25-LNA-PDEas ON-treated compared to PBS-treated eyes (P < 0.0001) or untreated eyes (P < 0.0001) (asterisk). Results were expressed as means ± SD, represented as vertical bars, and compared using the non-parametric Mann–Whitney test.

