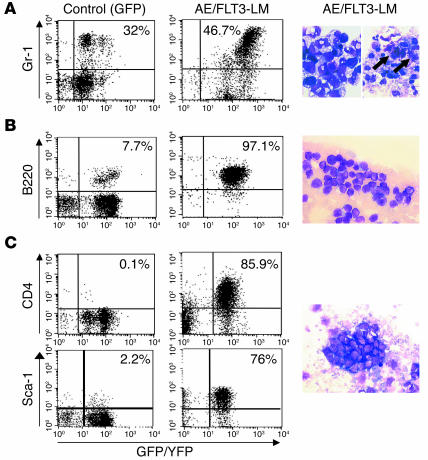
Figure 4.
Immunophenotype and morphology of hematopoietic cells recovered from leukemic mice. The plots show representative FACS profiles from BM cells in comparison with cells from GFP control animals, with indication of the proportion of positive cells within the GFP+/YFP+ compartment. The photographs show cytospin preparations (H&E; magnification, ×630) from peripheral blood (A, right image; B and C) and from BM (A, left image). (A) AML with a dominant mast cell population (marked by arrows) (mouse no. 16). (B) B-ALL (mouse no. 17). (C) T-ALL (mouse no. 20).

