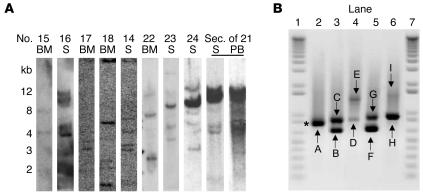
Figure 6.
Analysis of proviral integrations. (A) Southern blot analysis of genomic DNA from different primary mice and a secondary recipient to detect clonal proviral integrations. DNA was digested with EcoRI, which cuts once in the proviral sequence, and blots were hybridized to a GFP/YFP probe. The mouse numbers are indicated (corresponding to those in Table 2). S, spleen; PB, peripheral blood; sec. of 21, second mouse of 1° mouse no. 21. (B) Bubble PCR analyses of retroviral integration sites in diseased mice. The bands (A–I) were isolated, subcloned, and sequenced. A description of the PCR products is given in Table 3. Asterisk indicates resolution as 2 unique bands after subcloning and sequencing of integration sites.

