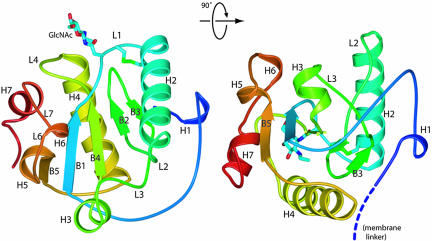
Fig. 1.
Overall structure of the ectodomain of PGRP-LCa in ribbon model. Ribbon diagram showing the front face (Left) and a side view (Right) of the LCa ectodomain. The ribbon is colored from N to C terminus in a progression from blue to red. The disulfide bridge and the N-linked sugar are shown as stick models. The linker connecting the N terminus of the structure to the transmembrane segment, which is not included in the protein construct, is indicated by the dashed coil.

