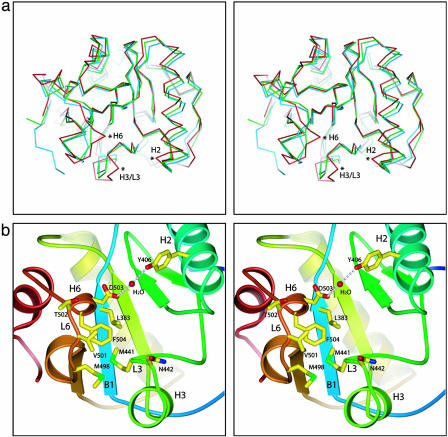
Fig. 2.
Structure analysis of the LCa ectodomain. (a) Stereoview of the LCa ectodomain (red) superimposed with PGRP-SA (blue) and -IαC (green) in Cα traces by using the central β-sheet as a reference. Regions with significant conformational changes are marked with asterisks. (b) Closeup stereoview of the front face of the LCa ectodomain. Side chains of the selected residues described are in stick representation.

