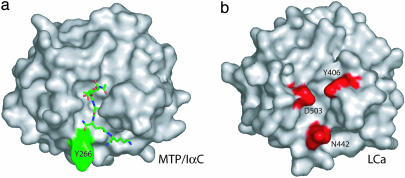
Fig. 3.
Molecular surfaces of PGRP-IαC and the LCa ectodomain. (a) Surface representation of PGRP-IαC complexed to MTP (see text), which is shown as a stick model. Residue Tyr-266 is highlighted. (b) Surface representation of the front face of the LCa ectodomain. Residues Asn-442, Asp-503, and Tyr-406 are highlighted.

