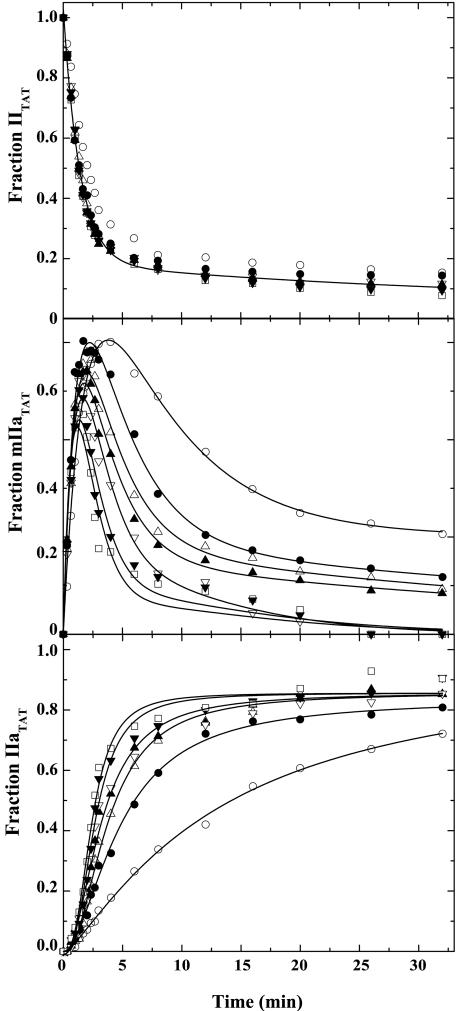
Fig. 4.
Modulation of IITAT cleavage by DAPA. IITAT (5.4 μM) was activated by 0.8 nM prothrombinase (0.8 nM Xa/28 nM Va/20 μM PCPS) in the presence of 0 (○), 20 μM (•), 40 μM (▵), 60 μM (▴), 100 μM (▿), 200 μM (▾), and 300 μM (□) DAPA. Progress curves, obtained by SDS/PAGE and quantitative densitometry, illustrate the fates of IITAT (Top), mIIaTAT (Middle), and IIaTAT (Bottom). Additional data points extending to 120 min have been omitted for clarity. All lines were arbitrarily drawn.

