
Figure 2.
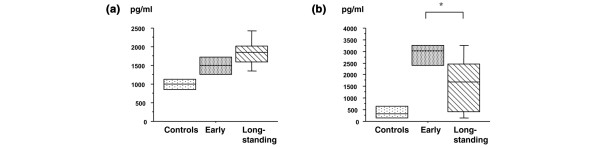
Box–whisker plots showing concentrations in serum for the patients with rheumatoid arthritis and healthy controls. (a) Soluble tumour necrosis factor receptor 1; (b) bombesin/gastrin-releasing peptide. Boxes show the 25th and 75th percentiles; horizontal lines in boxes show the medians; whiskers show the 10th and 90th percentiles. *P < 0.05.