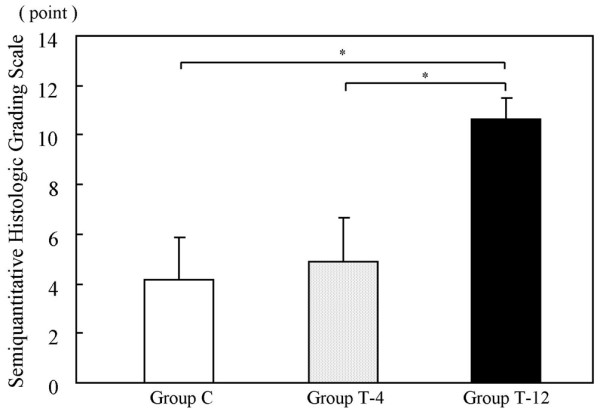
Figure 5.

Bar graph representing semiquantitative histologic gradings for the three groups of rabbits with cartilage defects. Group with control (untreated) defects (group C); and groups given tissue-engineered cartilage implants at 4 weeks after implantation (group T-4) and 12 weeks after implantation (group T-12). Error bars represent standard deviations. *P < 0.05 on the nonparametric Mann–Whitney U test.
