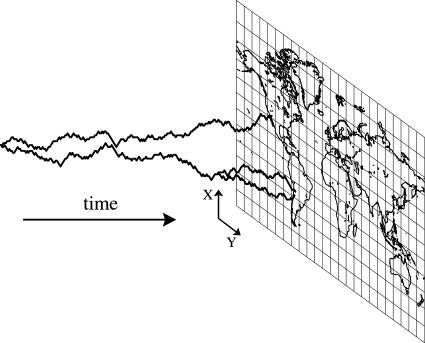
Fig. 1.
Illustration of the simulation of a spatial genealogy. Only 3 of the 248 lineages are shown for clarity, corresponding to three of the Pseudomonas samples. At the present (at right), their locations correspond to locations where samples were taken. They are simulated in two spatial dimensions backward in time (shown as a third dimension) until all have coalesced.

