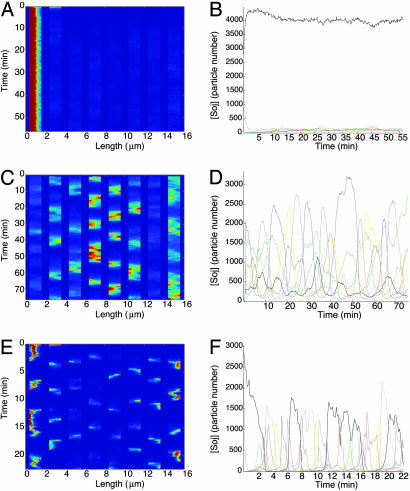
Fig. 3.
(A, C, and E) Space-time plots of nucleoid-bound Soj concentration; bright colors represent high concentration on a nucleoid. (B, D, and F) Number of Soj proteins on each nucleoid as a function of time. (A and B) Stochastic simulations of filamentous cells depleted for FtsZ. (C–F) Simulated Spo0J19 mutants lacking FtsZ. (C and D) Model I. (E and F) Model II. In both cases, the dependence on the poles is lost, and Soj is able to relocate from nucleoid to nucleoid well away from polar regions.

