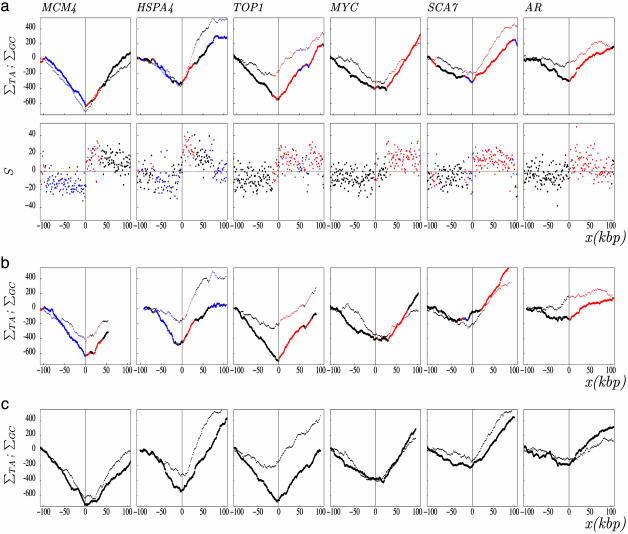
Fig. 1.
TA and GC skew profiles around experimentally determined human replication origins. (a) The skew profiles were determined in 1-kbp windows in regions surrounding (±100 kbp without repeats) experimentally determined human replication origins (see Data and Methods). (Upper) TA and GC cumulated skew profiles ΣTA (thick line) and ΣGC (thin line). (Lower) Skew S calculated in the same regions. The ΔS amplitude associated with these origins, calculated as the difference of the skews measured in 20-kbp windows on both sides of the origins, are: MCM4 (31%), HSPA4 (29%), TOP1 (18%), MYC (14%), SCA7 (38%), and AR (14%). (b) Cumulated skew profiles calculated in the six regions of the mouse genome homologous to the human regions analyzed in a.(c) Cumulated skew profiles in the six regions of the dog genome homologous to human regions analyzed in a. The abscissa (x) represents the distance (in kilobase pairs) of a sequence window to the corresponding origin; the ordinate represents the values of S given in percent. Red, (+) genes (coding strand identical to the Watson strand); blue, (–) genes (coding strand opposite to the Watson strand); black, intergenic regions. In c, genes are not represented.

