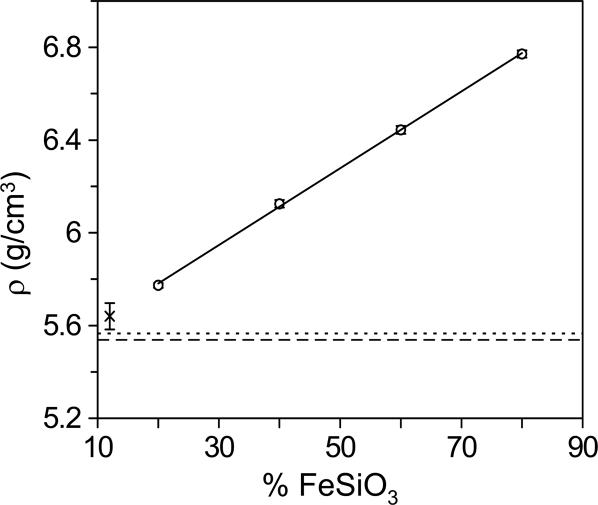
Fig. 3.
Density of the ppv phase as a function of x. For comparison, results are corrected to the same pressure at 130 GPa using the theoretical bulk modulus and elastic constants (11, 29). Density is shown with comparison to Fs12 silicate perovskite (× symbol shown with 1% error bar) (21) and the α-PbO2-type (dotted line) and CaCl2-type (dashed line) SiO2 phases (30).

