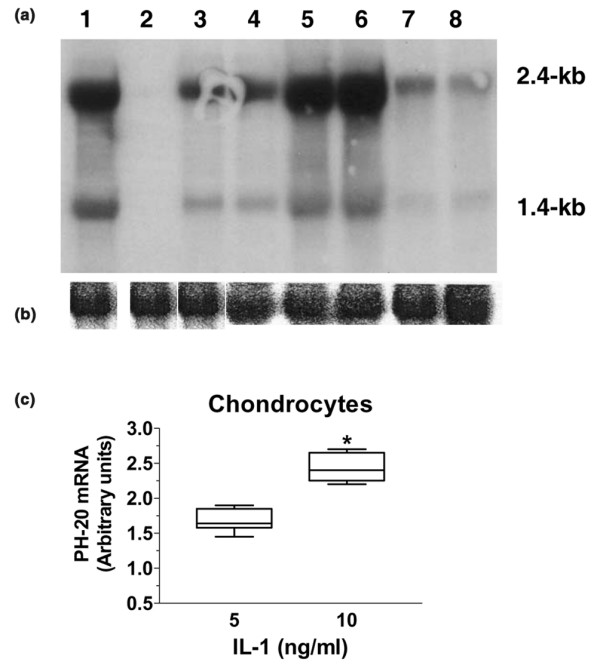
Figure 2.

Northern blot analysis of mRNA from various connective tissue cell lines. (a) A radiolabelled PH-20 cDNA probe was hybridized to a northern blot containing 25 μg/lane of total RNA from (1) testis (positive control); (2) liver (negative control); (3) synoviocytes; (4) chondrocytes; (5) chondrocytes stimulated with 5 ng/ml of IL-1; (6) chondrocytes stimulated with 10 ng/ml of IL-1; (7) fibroblasts; (8) a chondrosarcoma cell line. (b) For loading control, the same blot was stripped and hybridized with a β-actin probe. (c) Column box–whisker plot showing the relative increase of the PH-20 2.4-kilobase transcript in chondrocytes stimulated with IL-1 at two concentrations (n = 5; *P = 0.0004 by paired t-test).
