
Figure 3.
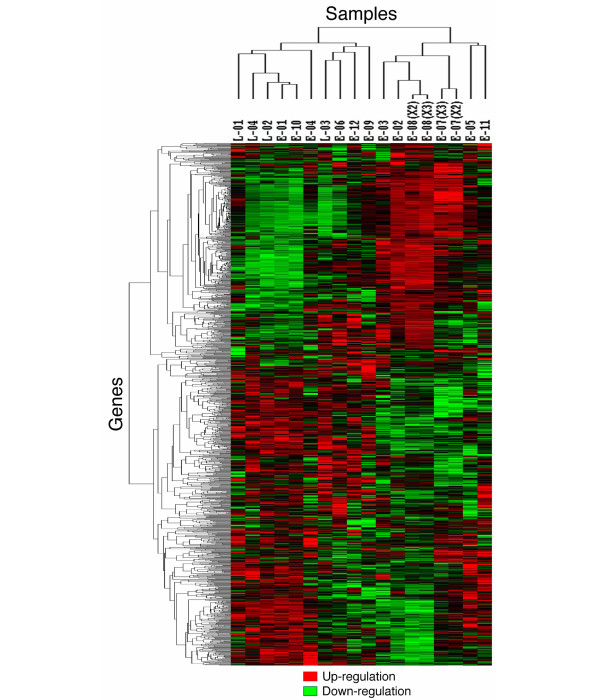
Dendrogram of two-dimensional hierarchical clustering analysis of 1,035 genes from patients with rheumatoid synovitis. Red represents relative expression greater than the median expression level among all samples, and green represents relative expression lower than the median expression level. The color intensity represents the magnitude of the deviation from the median. Black indicates unchanged expression. On the horizontal axis, 18 samples from rheumatoid synovitis were clustered into two major groups. On the vertical axis, the 1,035 genes were clustered in different branches according to similarities in their relative expression ratios.