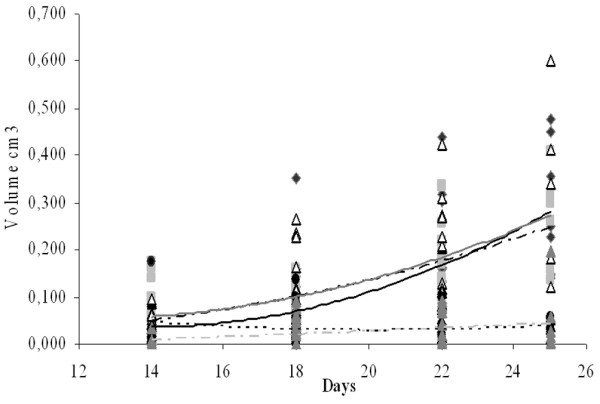
Figure 1.

Rate of tumour growth. Results are expressed as the volume (cm3) of the tumour for each mouse of different groups (tumour control group, black circle and line; P(+) 2d group, grey square and dark grey line; P(-) 2d group, white triangle and black broken line; P(+) 7d group, black diamond and lines of points; P(-) 7d group, grey triangle and light grey broken lines) with the tendency line for each group.
