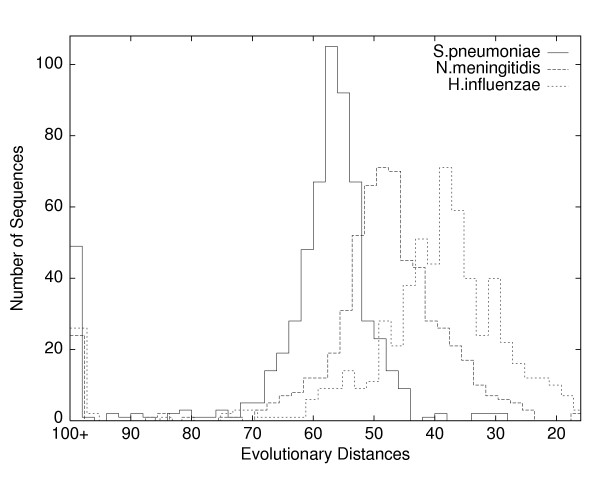
Figure 6.
Histograms of evolutionary distances. Plotted are the evolutionary distances, between E. coli and three other bacteria, Streptococcus pneumoniae, Neisseria meningitidis, and Haemophilus influenzae. Each distance D(i, j, k), described in the Methods section, is given by a pairwise alignment of amino acid sequences of a given length (typically 300 residues), the most conserved subsequences for a family of orthologous proteins. We can interpret distances as times, with greater time towards the left. All three histograms are roughly bell-shaped but with rather high variances, which suggests that reliable phylogenetic inference requires either a great many sequences or representative sequences that sit near the center in all pairwise histograms. The peaks at 100+ indicate missing orthologs. There are several apparent horizontal transfers (right-side outliers) in S.pneumoniae and N.meningitidis. Even discounting the peaks at 100+, the left-side outliers (rapid evolution, large insertions or deletions, missing domains, hidden paralogs, and horizontal transfers from more distant organisms) outnumber right-side outliers; this pattern holds true even for very distant pairs such as S.pneumoniae and E.coli.

