
Figure 1.
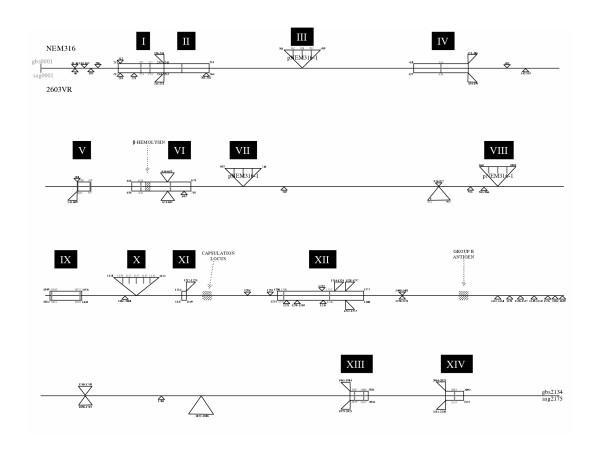
A representation of the serotype III (NEM316; gbs001-2136) and serotype V (2603VR; sag001-2175) genomes (diagrammatic and not to scale). The genome sequences are mostly identical (represented by a horizontal line), triangles above the line represent gene regions unique to NEM316, and the triangles below are those present only in 2603VR. Boxed regions are putative PAIs (marked I to XIV). Grey bars with the PAIs represent genes amplified as surrogate markers for the presence of the whole island. Similar information can now be visualised through GenePlot, the NCBI pairwise comparison of protein homologs http://www.ncbi.nlm.nih.gov/sutils/geneplot.cgi.