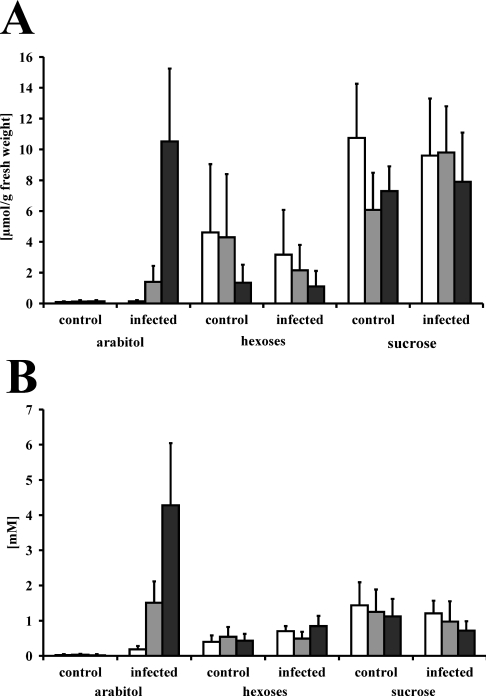
Figure 5. Sugar and sugar alcohol concentrations in infected and non-infected (control) V. faba leaf extracts (A) and apoplastic fluids (B).
Metabolites were analysed by HPLC 3 (white bars), 5 (grey bars) and 12 days (black bars) post infection. Concentrations are given as μmol/g of fresh weight for leaf extracts and mM for apoplastic fluids. Results are means±S.E.M. (n=6 for leaf extracts; n=10–15 for apoplastic fluids). ‘hexoses’ represents the sum of glucose and fructose.

