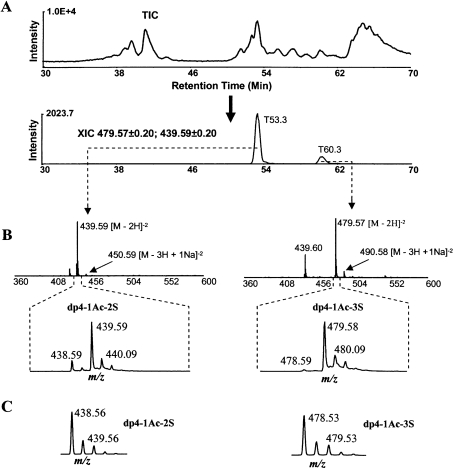
Figure 3. The modification degrees at 3-OST-1 sites.
(A) TIC of the nitrous acid-digested, 34S/3-OST-1-saturated HS sample is followed by XIC at m/z 439.59±0.2 and 479.58±0.2. The XIC had peaks at T53.3 and T60.3. (B) The mass spectra and m/z clusters of the two 3-OST-1-labelled oligosaccharides. The two oligosaccharides were identified to be a dp4-1Ac-2S and a dp4-1Ac-3S. The peak at T60.3 in the XIC exhibited m/z 439.60, 479.57 and 490.58. The m/z 439.60 was caused by the loss of a sulphate from m/z 479.57. (C) The isotope clusters of dp4-1Ac-2S and dp4-1Ac-3S, generated by a computer program according to the natural abundances of stable isotopes.

