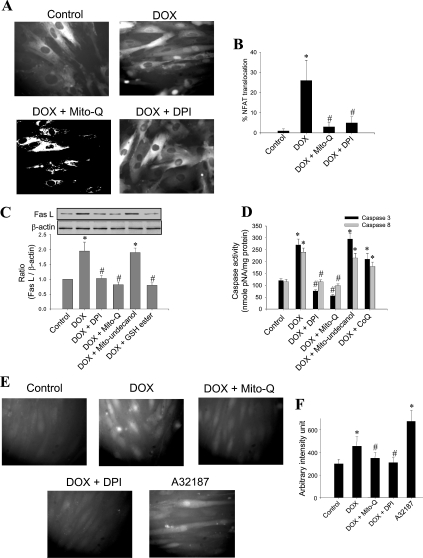
Figure 3. Effect of DPI and Mito-Q on DOX-induced caspase activity, Fas L expression and calcium levels.
(A) NFAT–GFP-overexpressing cells were treated with 1 μM DOX in the presence or absence of Mito-Q (1 μM) and DPI (5 μM) for 8 h, and the fluorescence pictures were captured using a Nikon fluorescence microscope equipped with FITC filter settings. (B) Cells demonstrating the nuclear translocation of NFAT–GFP were manually counted from five different fields of view, and the values shown are the means±S.D. for three separate experiments. (C) H9c2 cells were treated with 1 μM DOX in the presence or absence of 5 μM DPI, 1 μM Mito-Q, 1 μM Mito-undecanol or 2 mM GSH ester for 8 h. The Western blot for Fas L was performed. Densitometric results shown are the means±S.D. for three separate experiments. (D) Caspase-3 and -8 activities were determined. Results shown are the means±S.D. for three separate experiments. (E) H9c2 cells were treated with 1 μM DOX in the presence and absence of Mito-Q and DPI for 8 h. After terminating the incubation, cells were washed and incubated with 5 μM Fluo 3-AM for 30 min. The medium was subsequently aspirated, cells were washed twice with DPBS, and fluorescence images were captured in a Nikon fluorescence microscope equipped with FITC filter settings. (F) Fluorescence intensity was calculated using Metamorph software. Values were averaged from five different fields of view, and the results shown are the means±S.D. for three separate experiments. *P<0.05 for (B) (C) and (F); *P<0.01 for (D). #P<0.05 compared with the DOX-treated group for (B), (C) and (F); #P<0.01 for (D).

