
FIGURE 2.
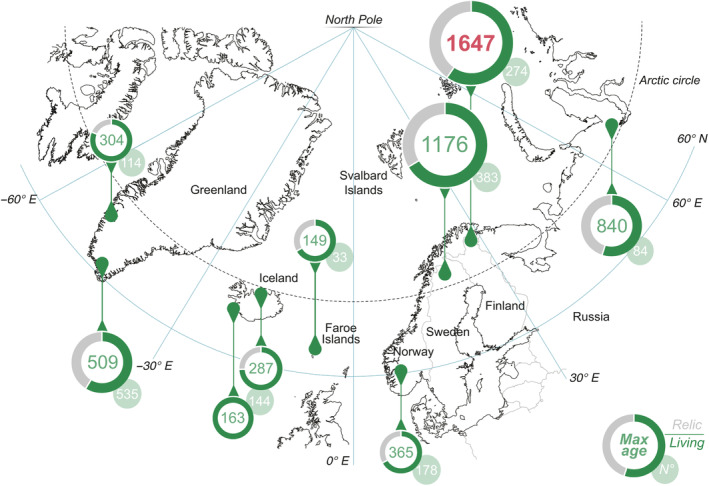
Common juniper ages across the tundra biome. The numbers represent the maximum juniper age and the number of individuals sampled at each site. Pie charts show the percentages of living (green) and dead (gray) individuals collected.
Official websites use .gov
A
.gov website belongs to an official
government organization in the United States.
Secure .gov websites use HTTPS
A lock (
) or https:// means you've safely
connected to the .gov website. Share sensitive
information only on official, secure websites.
Common juniper ages across the tundra biome. The numbers represent the maximum juniper age and the number of individuals sampled at each site. Pie charts show the percentages of living (green) and dead (gray) individuals collected.