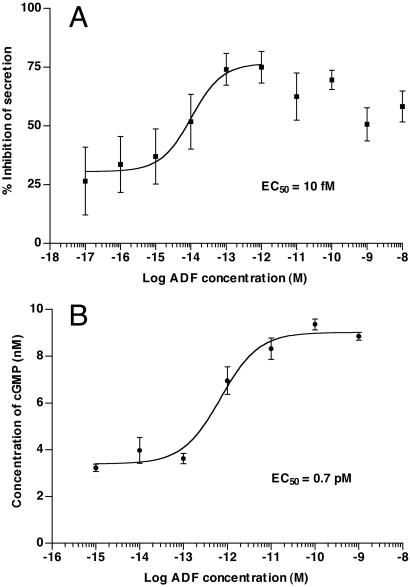
Figure 3.
(A) Dose–response curve for T. molitor ADF with Malpighian tubules of larval T. molitor. Fluid secretion was measured at various concentrations of hormone and the percent inhibition determined. The data are given as % inhibition of secretion ± standard error, and were fitted by nonlinear regression analysis using PRISM 3.0, fitting only data from 10−17 to 10−12 M because of apparent desensitization at higher concentrations. The EC50 is 10 fM (95% CL = 2.8–38 fM). Basal secretion was determined on Malpighian tubules initially in control solution (Ringer's saline); subsequently this was replaced with more Ringer's solution or Ringer's solution containing antidiuretic factor. All fractions contained 0.5 mg/ml BSA. Some loss of basal secretion is always observed after fluid replacement; this accounts for the response never reaching zero inhibition. (B) Dose–response curve for T. molitor ADF, but measuring elevation of cGMP in adult Malpighian tubules rather than fluid secretion. The EC50 is 0.7 pM (95% CL = 0.36–1.4 pM), 70 times higher than the EC50 for fluid secretion.

