

Abstract
Neurofibromin (NF1), a Ras GTPase‐activating protein (GAP), catalyzes Ras‐mediated GTP hydrolysis and thereby negatively regulates the Ras/MAPK pathway. NF1 mutations can cause neurofibromatosis type 1 manifesting tumors, and neurodevelopmental disorders. Exactly how the missense mutations in the GAP‐related domain of NF1 (NF1GRD) allosterically impact NF1 GAP to promote these distinct pathologies is unclear. Especially tantalizing is the question of how same‐domain, same‐residue NF1GRD variants exhibit distinct clinical phenotypes. Guided by clinical data, we take up this dilemma. We sampled the conformational ensembles of NF1GRD in complex with GTP‐bound K‐Ras4B by performing molecular dynamics simulations. Our results show that mutations in NF1GRD retain the active conformation of K‐Ras4B but with biased propensities of the catalytically competent populations of K‐Ras4B–NF1GRD complex. In agreement with clinical depiction and experimental tagging, compared to the wild type, NF1GRD E1356A and E1356V mutants effectively act through loss‐of‐function and gain‐of‐function mechanisms, leading to neurofibromatosis and developmental disorders, respectively. Allosteric modulation of NF1GRD GAP activity through biasing the conformational ensembles in the different states is further demonstrated by the diminished GAP activity by NF1GRD isoform 2, further manifesting propensities of conformational ensembles as powerful predictors of protein function. Taken together, our work identifies a NF1GRD hotspot that could allosterically tune GAP function, suggests targeting Ras oncogenic mutations by restoring NF1 catalytic activity, and offers a molecular mechanism for NF1 phenotypes determined by their distinct conformational propensities.
Keywords: developmental disorder, GTPase‐activating protein, mutations, neurofibromatosis type 1, neurofibromin, Ras
1. INTRODUCTION
Neurofibromatosis type 1 is one of the most common genetic diseases caused by inherited or de novo germline mutations in tumor suppressor gene NF1 on chromosome 17q11.2 (Yap et al. 2014). Its phenotypes are highly variable, showing a wide range of clinical manifestations (Kiuru and Busam 2017). Patients with the disease develop benign peripheral nerve tumors and plexiform neurofibromas that can form malignant peripheral nerve sheath tumors (MPNSTs) (Ratner and Miller 2015). The optic pathway glioma (OPG) is another common tumor in individuals with the disease (Ratner and Miller 2015). Children with the disease have increasing risk for neurodevelopmental disorders including learning deficits, autism symptomatology, and impairment in attention and social skills (Vogel et al. 2017). Mutations in the NF1 gene can also lead to abnormalities in the cardiovascular and musculoskeletal systems (Friedman et al. 2002; Patel and Stacy 2012).
Tumor suppressor protein neurofibromin (NF1) is a multifunctional protein (Baez‐Flores et al. 2023; Gutmann et al. 1991). The well‐characterized GTPase‐activating‐protein‐related domain (GRD) functions as Ras GTPase‐activating protein (GAP) by accelerating Ras‐mediated GTP hydrolysis, thus negatively regulating Ras/MAPK signaling pathway (Rauen 2022). More than 5000 somatic variants have been identified in human tumors, spreading over the entire NF1 gene (Baez‐Flores et al. 2023). Mutations on the GRD of NF1 (hereafter referred to as NF1GRD) are of particular interest as they are closely related to NF1 pathogenesis (Scheffzek and Shivalingaiah 2019). Loss‐of‐function mutation R1276P/Q significantly reduced the NF1 GAP catalytic efficiency (~8000‐fold or 500‐fold reduction compared with the wild type), with Arg1276 being the most essential catalytic residue (arginine finger) for GAP‐stimulated GTP hydrolysis reaction of Ras‐GTP (Ahmadian et al. 1997; Fahsold et al. 2000; Klose et al. 1998). The missense mutation R1391S identified in NF1 patients displayed ~300‐fold lower activity than the wild‐type NF1GRD (Upadhyaya et al. 1997). A subsequent crystal structure of NF1GRD in complex with Ras revealed that Arg1391 is located in the binding interface between NF1GRD and Ras (Rabara et al. 2019). Other patient‐derived mutations (e.g., mutations identified from patients, such as E1356G/K and S1463F) that are distant from the catalytic site and the binding interface between NF1 and Ras were also reported (Scheffzek and Shivalingaiah 2019), but the correlation between the impact of these mutations on GAP activity and their clinical significance is less clear.
Same‐gene mutations can promote both cancer and neurodevelopmental disorders (Nussinov et al. 2022; Nussinov et al. 2023c), as shown by mutations on Src homology 2 domain‐containing protein tyrosine phosphatase 2 (SHP2) encoded by the PTPN11 gene (Liu et al. 2023b), by multiple mutations in phosphatase and “tensin” homolog (PTEN) phosphatase, for example, H93Y, H93D, H93Q; T131I, T131N; C105F, C105F/Y (Jang et al. 2021; Jang et al. 2023), and by K‐Ras G12D (Schmidt et al. 2021). The distinct phenotypes of mutational variants on a protein can be predicted from their relative conformational propensities (Nussinov et al. 2023a; Nussinov et al. 2023b). K‐Ras4B harboring cancer driver mutations prefers an active conformation (state 2) in favor of interactions with effectors (Kolch et al. 2023; Nussinov et al. 2023a). The Ras‐homology small GTPase RhoA mutants (A161P and A161V) in the GDP‐bound state favor a conformation resembling the active conformation of wild‐type RhoA, endowing effector binding activity (Lin et al. 2024). NF1GRD seems to follow the same scenario. The E1356A mutant from the ClinVar database (Landrum et al. 2014), as well as the E1356G/K in other reports, are associated with neurofibromatosis type 1. Due to its rare occurrence, the E1356A variant was classified as “Uncertain significance,” indicating that it is still unclear whether it is pathogenic or benign. The E1356V mutant from the de novo database (https://denovo-db.gs.washington.edu/denovo-db/) shows that E1356V is related to neurodevelopmental disorders (Deciphering Developmental Disorders Study 2017). How mutations of the same residue allosterically differentially modulate NF1 GAP activity is puzzling. Insight into such mechanisms is critical, as it may offer novel strategies for repressing active K‐Ras4B mutants by increasing RasGAP activity (Berta et al. 2023). Besides mutations, the alternative splicing of exon 23a of the NF1 gene inserts additional 21 residues into the NF1GRD domain, leading to NF1 isoform 2 (Andersen et al. 1993). This NF1 variant suppresses its GAP activity (Hinman et al. 2014), dysregulates Ras/ERK signaling, and impairs learning and memory in mouse models (Cui et al. 2008; Nguyen et al. 2017). However, the structural basis for the regulatory role of this insertion in NF1 GAP activity has been unclear.
Here, we performed molecular dynamics (MD) simulations to explore the conformational propensities of NF1GRD in complex with GTP‐bound K‐Ras4B (Figure 1). Our results show that NF1 binding retains the conformation of the catalytic site of K‐Ras4B, making it insensitive to NF1GRD mutations. The complementary electrostatic interactions between NF1GRD and K‐Ras4B contribute to the stability of the GTPase transition state. Compared to the wild‐type NF1GRD, E1356A and E1356V mutants populate the catalysis‐competent conformations differently, leading to a loss of function and gain of function, respectively. In contrast, the 23a insertion of NF1 isoform 2 distorts the structure of the active site of K‐Ras4B and populates the inactive conformation of K‐Ras4B. Our results suggest that the NF1 GAP activity can be allosterically modulated, offering a new avenue for the development of NF1GRD mutants/binders that fine‐tune its GAP activity.
FIGURE 1.

Sequence and modeled structure of NF1 GRD in complex with GTP‐bound K‐Ras4B. (a) Sequence of K‐Ras4B including residues Met1‐Lys169, and NF1 GRD (NF1GRD for short) including residues Phe1205‐His1530. The position of the arginine finger Arg1276 in NF1 GRD is indicated by an arrow. The nonpolar, basic, acidic, and polar residues are colored black, blue, red, and green, respectively. (b) The initial structure of K‐Ras4B–NF1GRD complex. The Switch I (residues 25–40) and Switch II (residues 60–76) regions of K‐Ras4B are colored yellow and magenta, respectively. The GTP molecule is shown as stick representation and Mg2+ is shown as a green sphere. The arginine finger Arg1276 and Glu1356 are also shown as stick representation. Note that the initial complex is in the ground OFF‐state in which Arg1276 has not interacted with the γ‐phosphate of GTP (highlighted on the right panel).
Allostery is complex and how nature exploits it for function is riveting, as shown by the remarkable series of papers by the Melacini's lab (Akimoto et al. 2022; Byun et al. 2020), and the recent observations by the Hristova lab (Karl et al. 2024; Krzyscik et al. 2024; Wirth et al. 2024). Their work documented that different FGF ligands, and mutations, can trigger dramatically different biological responses of a single FGFR receptor through altered phosphorylation events, and especially, the quantification of the induced bias in EGFR phosphorylation (Wirth et al. 2023). The mechanisms explored here could similarly act via differential allosteric biasing of the conformational ensembles.
2. RESULTS
2.1. Mutations on NF1GRD retain the active conformation of K‐Ras4B
The initial complex structure shows that K‐Ras4B‐GTP interacts with NF1GRD in the ground OFF‐state, in which the side chain of the arginine finger (Arg1276) has not moved into the active site of K‐Ras4B (Figure 1b). In contrast, the ground ON‐state refers to the conformational state in which the side chain of Arg1276 has interacted with the γ‐phosphate of GTP. To investigate the conformational change of K‐Ras4B upon binding of wild‐type and mutant NF1GRD, we examined the coordination environment of the active site of K‐Ras4B. Mg2+ is hexa‐coordinated with one oxygen from each of the β‐ and γ‐phosphates, the two side chain hydroxyl groups of Ser17 and Thr35, and two water molecules. In addition, Gly13, Lys16, and Gly60 coordinate the GTP (Figure 2a). Two stably Mg2+‐coordinated water molecules were observed throughout MD simulations of all systems. We calculated the corresponding distances between the protein residues and GTP/Mg2+ and found that our simulation results were in good agreement with the experimental values (Figures 2b–d and S1), indicating that mutations (E1356A/V and R1276P/Q) on the NF1GRD have little impact on the conformation of the active site of K‐Ras4B. Notably, we observed that the arginine finger moved into the active site of K‐Ras4B in the complexes comprising the wild‐type and the E1356V mutant of NF1GRD, but not always in the complex comprising E1356A mutant. The involvement of Arg1276 of NF1 in the active site of K‐Ras4B indicated that the complex switched from the ground OFF‐state to the ground ON‐state. Such a state transition seems less favorable for NF1GRD carrying the E1356A mutation as the state transition was only observed in one of the three replica simulations (Figure 2c). In contrast, for the wild‐type and E1356V mutant, the state transition was observed in all replica simulations (Figure 2b,d). These data suggest that the long‐range mutations (E1356A and E1356V) on the NF1GRD may affect the catalytic activity of NF1 GAP differently.
FIGURE 2.

Interactions within the active site of K‐Ras4B–NF1GRD complexes. (a) The active conformation of the catalytic site of K‐Ras4B. Mg2+ is hexa‐coordinated with the β‐ and γ‐phosphates of GTP, the side chain of Ser17 and Thr35, and two water molecules. Gly13, Lys16, and Gly60 coordinate the GTP. In the ground ON‐state, Arg1276 interacts with the γ‐phosphate of GTP, and the distance between Arg1276 and GTP was calculated based on the distance between the nitrogen atom of the “amino group” of Arg1276 and the oxygen atom of the γ‐phosphate of GTP. (b) The distances corresponding to the Mg2+ and GTP coordination, as well as between Arg1276 and GTP, calculated for wild‐type NF1GRD in complex with K‐Ras4B. (c) The corresponding distances for K‐Ras4B–NF1GRD complex with E1356A mutant. (d) The corresponding distances for K‐Ras4B–NF1GRD complex with E1356V mutant. The hollow circle, square, and triangle represent data from three independent trajectories of the same system. The black square shown in (b) represents experimental value taken from the crystal structure (PDB ID: 6OB2). The interactions in the active site of K‐Ras4B indicate that K‐Ras4B–NF1GRD complex harboring E1356 mutant retains the active conformation of K‐Ras4B when it transitions from the ground OFF‐state to the ground ON‐state.
2.2. E1356 mutants are primed for GAP‐catalyzed GTP hydrolysis
To obtain the representative conformation of each complex, we merged three replicas of each system and performed clustering analysis using the ensemble clustering method implemented in Chimera software (Kelley et al. 1996; Pettersen et al. 2004). Conformationally related clusters were generated based on the best pairwise root‐mean‐square deviations (RMSDs) between different conformations with automatically determined cut‐off values in the clustering (Kelley et al. 1996). The representative conformations were selected from the largest cluster of each system and superimposed with each other. Here we focused on the conformational change of K‐Ras4B and compared with the crystal structure of wild‐type GTP‐bound K‐Ras4B (Figure 3a). The calculated Cα RMSD between different conformations and the wild‐type K‐Ras4B is 1.3 Å, suggesting that the binding of E1356 mutants of NF1GRD has little effect on the active conformation of K‐Ras4B. Of particular interest are the orientations of two residues, Tyr32 and Thr35, on Switch I of K‐Ras4B. In the initial, ground OFF‐state, Tyr32 forms a “hydrogen bond” by interacting with the oxygen atom of the γ‐phosphate of GTP via its hydroxyl group, blocking the interaction between the arginine finger Arg1276 and the GTP (Figure S2). In the ground ON‐state, we observed similar rearrangement of the orientation of Tyr32 in different systems, which allows the arginine finger to interact with the γ‐phosphate of GTP. The influence of Tyr32 on GTP hydrolysis has been studied by simulations and Fourier transform infrared experiments (Li et al. 2018; Rudack et al. 2015). Here, we calculated the distributions of the dihedral angle C‐Cα‐Cβ‐Cγ of Tyr32 in different systems (Figure S3). We observed that Tyr32 in the isolated K‐Ras4B populates two conformational states, corresponding to the Tyr32OUT and Tyr32IN substates observed earlier (Li et al. 2018). When K‐Ras4B binds to NF1GRD, Tyr32 predominantly adopts the Tyr32OUT conformation, which is also consistent with the previous finding that Tyr32 uses the Tyr32OUT substate to interact with GAPs (Li et al. 2018).
FIGURE 3.
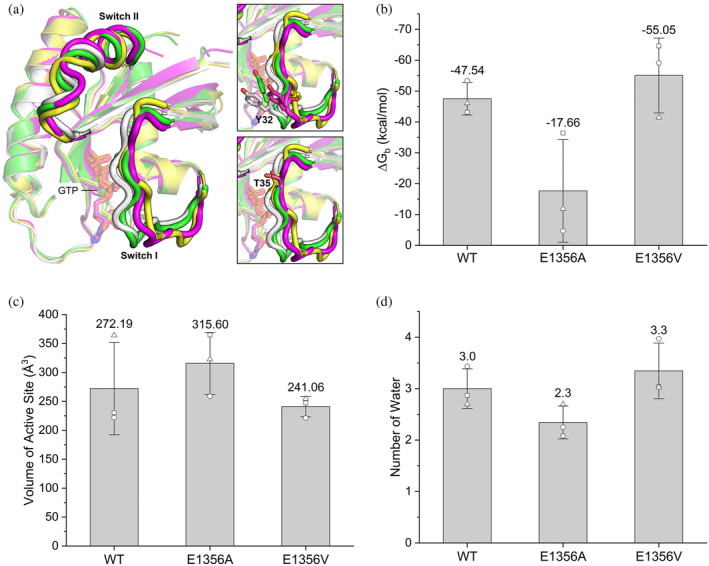
Structural characterization of K‐Ras4B–NF1GRD complexes. (a) Structure superimposition of the representative conformations of K‐Ras4B in the wild‐type (yellow), E1356A (green), and E1356V (magentas) K‐Ras4B–NF1GRD complexes. For comparison, the crystal structure of GTP‐bound H‐Ras determined at 100 K is also shown (white, PDB ID: 1QRA). The orientations of Tyr32 and Thr35 of Ras are highlighted in the right panel. (b) The binding affinity between GTP‐bound K‐Ras4B and NF1GRD is evaluated in terms of the binding free energy for different systems. (c) The volume of the active site of K‐Ras4B for different systems. (d) The number of water molecules within 4 Å of the γ‐phosphate of GTP, excluding the two water molecules that stably coordinated to Mg2+. The hollow circle, square, and triangle represent data from three independent replicas of the same system. Compared to the wild‐type NF1GRD, E1356 mutants are primed for GAP‐catalyzed GTP hydrolysis.
The dynamics of Thr35 are critical for the conformation of Switch I, and Thr35 mutations shifted the active conformation of K‐Ras4B to the non‐binding conformations that have a reduced affinity to Ras effector proteins such as Raf and RalGDS (Matsumoto et al. 2016; Shima et al. 2010; Spoerner et al. 2001). Our results show that compared to the wild‐type K‐Ras4B, Thr35 exhibits a similar orientation upon binding to E1356‐mutated NF1GRD, suggesting that the conformations of Switch I of K‐Ras4B are preserved. Structural superposition (Figure 3a) and the calculated distance between Gly60 (in Switch II) and GTP (Figure 2) imply that the conformations of Switch II of K‐Ras4B are also maintained. These results indicate that the E1356 mutants have little effect on the active conformation of the GTP‐bound K‐Ras4B.
Here we showed that both wild‐type and E1356 mutant NF1GRD can switch to the ground ON‐state when bound to the active state of K‐Ras4B, with Switch I stabilized by the interaction of Thr35 with the nucleotide and Mg2+. The GAP‐stimulated GTP hydrolysis by K‐Ras4B needs to meet other structural and enzymatic requirements, including adequate binding affinity, appropriate volume of the active site, the number of available water molecules, and the proper orientation of Gln61 in Switch II of K‐Ras4B. We characterized these properties and delineated the difference between the wild‐type and mutant NF1GRD.
The binding free energy is applied to estimate the relative binding affinity between the K‐Ras4B and NF1GRD (Figure 3b). Compared to the wild‐type NF1GRD (−47.5 ± 5.3 kcal/mol), the E1356V mutant shows an increased binding affinity for K‐Ras4B (−55.1 ± 12.1 kcal/mol), whereas the E1356A mutant shows a reduced binding affinity for K‐Ras4B (−17.7 ± 16.6 kcal/mol). The high standard deviation in the binding free energy of E1356A is because the electrostatic interaction between the arginine finger Arg1276 and GTP occurred only once in three replica simulations. This result is consistent with early experimental data showing that single‐point mutant R1276A/Q/N displayed up to three‐fold reduced affinity for GMPPNP‐bound Ras (Ahmadian et al. 1997). Based on previous experimental data (Ahmadian et al. 1997), we plotted the binding affinity with respect to the NF1 GAP activity, and found that there is no direct correlation between the two measurements (Figure S4). In addition, previous experimental data also showed that the binding affinity of NF1GRD for GTP‐bound Ras is about 50‐fold higher than that of p120GAP (also known as RASA1) (Scheffzek et al. 1998), but the increase in the rate of GTP hydrolysis by NF1GRD is similar to that by p120GAP (Ahmadian et al. 1997; Scheffzek et al. 1998). Thus, the binding affinity between the NF1GRD and K‐Ras4B seems a prerequisite but not determinant for the catalytic efficiency of NF1 GAP.
The volume of the active site pocket centered on the γ‐phosphate of GTP was calculated using POVME 3.0 (Durrant et al. 2011; Durrant et al. 2014). For comparison, we performed 1 μs MD simulation on the nucleotide‐free K‐Ras4B and calculated the volume of the active site pocket. A value of 575.3 ± 66.9 Å3 is obtained, which is comparable to the value of 538.0 ± 93.8 Å3 calculated for the H‐Ras using the same program in a previous theoretical study (Calixto et al. 2019). In complex with NF1GRD (Figure 3c), the volume of the active site pocket of K‐Ras4B reduces to 272.2 ± 79.8 Å3. This value is very close to the calculated volume of the active site pocket of H‐Ras in complex with p120GAP (268.0 ± 33.5 Å3) (Calixto et al. 2019). For the E1356 mutants, we find a slight decrease in volume of 241.1 ± 17.5 Å3 for E1356V and an increase in volume of 315.6 ± 53.4 Å3 for E1356A due to its generally low binding affinity between NF1GRD and K‐Ras4B. Based on the proposed solvent‐assisted mechanism for GTP hydrolysis, the rate‐limiting step involves the nucleophilic attack of a water molecule, leading to a loose dissociative transition state followed by the proton transfer from the water molecule to the γ‐phosphate oxygen of GTP (Calixto et al. 2019). To examine the impact of the E1356 mutations on the solvation of the active site, we calculated the average number of water molecules within 4 Å of the γ‐phosphate group of GTP (Figure 3d). No significant change in the number of water molecules is observed due to different E1356 mutants. The presence of 2–3 water molecules in the vicinity of the γ‐phosphate is in agreement with the crystal structure of GTP‐bound Ras determined at a low temperature (100 K) (Scheidig et al. 1999), and the empirical valence bond simulation of GTP hydrolysis catalyzed by Ras and p120GAP (Calixto et al. 2019). Thus, the binding of E1356 mutant, like wild‐type NF1GRD, appears to be able to maintain catalytic water molecules at positions around the γ‐phosphate of GTP.
Lastly, we characterized the orientation of Gln61, an important catalytic residue on the Switch II of Ras. Gln61 was suggested to contribute to GTP hydrolysis by orientating the nucleophilic water molecule toward the γ‐phosphate of GTP (Martin‐Garcia et al. 2012; Scheffzek et al. 1997; Zeng et al. 2021). But its catalytic geometry was only found in the transition state of the catalytic reaction not in the ground state (Li and Zhang 2004). To examine the difference between wild‐type and mutated NF1GRD, we calculated the distance between Gln61 and the γ‐phosphate of GTP for different systems, and find that the distances are all around 7 Å, which cannot stably position one nucleophilic water molecule in the vicinity of the γ‐phosphate of GTP (Figure S5a). Such a result is in line with previous observations in the ground state of Ras‐like GTPase and G‐protein α subunits (Li and Zhang 2004). The conformational space sampled by Gln61 was further characterized by the distributions of its two dihedral angles (φ and ψ, Figure S5b). The binding of E1356A mutant slightly increased the flexibility of the side chain of Gln61, but still predominantly sampled the same conformations as shown in the wild‐type and E1356V mutant.
Taken together, our results imply that there may exist a higher barrier that prevents E1356A mutant from switching to the ground ON‐state. However, our structural characterization shows no significant difference in the conformational state of K‐Ras4B and its catalytic site in the presence of wild‐type and E1356‐mutated NF1GRD. It appears that all complexes are primed for the GAP‐catalyzed GTP hydrolysis by K‐Ras4B, which in turn raises an intriguing question of how the mutations on the NF1GRD differentially affect the catalytic efficiency of K‐Ras4B. Below, we seek clues by examination of the interaction between K‐Ras4B and NF1GRD.
2.3. E1356 mutants differentially populate catalysis‐competent conformations
The interaction between NF1GRD and GMPPNP‐bound K‐Ras4B has been characterized in terms of the two available crystal structures in the absence (PDB ID: 6OB2) (Rabara et al. 2019) and presence of Spred1 (PDB ID: 6V65) (Yan et al. 2020). The protein–protein binding interface is stabilized by four conserved salt bridges: Asp37Ras–Lys1419NF1, Glu38Ras–Lys1423NF1, Glu62Ras–Lys1283NF1, and Glu63Ras–Arg1391NF1. In the presence of Spred1, an additional salt bridge is formed between Asp54Ras and Arg1325NF1. In our simulations of K‐Ras4B–NF1GRD complex, we also observed another salt bridge between Asp33Ras and Lys1436NF1 that contributed to the association of the two proteins. We calculated the populations of these six salt bridges and observed significant differences in the populations where these interactions occur at the interface between Switch II of K‐Ras4B and NF1GRD. Specifically, in the case of wild‐type NF1, Glu63 of K‐Ras4B could interact with Lys1283, Lys1290, and Arg1391, with Lys1290 being the preferred (Figure 4a). However, in the above crystal structures, Glu63 interacts with Arg1391. Such a difference could be due to (i) the crystal structures were solved using the GTP analog GMPPNP and (ii) both crystal structures are in the ground OFF‐state. As GMPPNP is a good analog of GTP for Ras (Scheidig et al. 1999), the switch from the ground OFF‐state to the ON‐state during our simulations, that is, with the interaction between the arginine finger Arg1276 and GTP, may cause a conformational change in the Switch II region of K‐Ras4B, consequently shifting the population harboring the Glu63–Arg1391 interaction. To support this, we calculated the relative populations of the salt bridges at the binding interface between K‐Ras4B and NF1GRD for both ground OFF and ON states (Figure S6). Binding of K‐Ras4B to the wild‐type NF1GRD maintained the interaction between Glu62 and K1283 in both the ON and OFF states but shifted the interaction of Glu63 with Arg1391 populated in the OFF state to the interaction with K1290 (most populated) in the ON state. This population shift was more pronounced in the E1356A mutant. In contrast, the Glu63–Arg1391 interaction was well maintained in the E1356V mutant.
FIGURE 4.

Different populations of the catalysis‐ready conformations of the wild‐type and mutated K‐Ras4B–NF1GRD complexes. (a) Populations of salt bridges at the binding interface between K‐Ras4B and wild‐type NF1GRD (left panel). The representative conformation of the active site of K‐Ras4B–NF1GRD complex, with the Glu63–Lys1290 salt bridge being preferred (right panel). (b) Populations of salt bridges at the binding interface between K‐Ras4B and NF1GRD E1356A (left panel). The representative conformation of the active site of K‐Ras4B–NF1GRD E1356A complex, with the Glu63–Lys1283 salt bridge being slightly preferred (right panel). (c) Populations of salt bridges at the binding interface between K‐Ras4B and NF1GRD E1356V (left panel). The representative conformation of the active site of K‐Ras4B–NF1GRD E1356V complex, with the Glu63–Arg1391 salt bridge being highly preferred (right panel). These interactions suggest that wild‐type and E1356 mutants differently populate catalysis‐prone conformations. The hollow circle, square, and triangle represent data from three independent replicas of the same system. The same ensemble clustering method used for Figure 3a was applied to obtain the largest cluster, from which the representative conformation was selected with the most populated salt bridge highlighted.
Previous experimental finding showed that free arginine, imidazole, and other small nitrogenous molecule fail to accelerate GTP hydrolysis (Patel et al. 2023). As such, interaction of the arginine finger Arg1276 with GTP has a more profound effect on the conformational state of K‐Ras4B–NF1GRD complex. As in the wild‐type NF1, we also observed the Glu63–Arg1391 interaction, with a lower population (37%) than the Glu63–Lys1290 interaction (60%) (Figure 4a). Compared to the wild‐type NF1GRD, the Glu63–Arg1391 interaction is significantly reduced (to 6%) in the E1356A mutant, and Glu63 seems to switch its interaction between Lys1290 (44%) and Lys1283 (48%), with Lys1283 being slightly favored (Figures 4b and S7). In contrast, for the E1356V mutant, Glu63 predominantly interacts with Arg1391 (93%), but can also interact with Lys1290 with a much lower population (34%) (Figure 4c). The stable and specific salt bridges between the residues in Switch I (Asp33, Glu37, and Asp38) of K‐Ras4B with NF1GRD provide a structural basis for the similar conformations of Switch I as observed in different systems (Figure 3a). This led us to ask whether the dynamics of the Glu63–Arg1391 interaction could be related to the NF1 GAP activity.
We characterized the conformational properties of the ground ON‐state of the NF1GRD in complex with K‐Ras4B‐GTP. During GTP hydrolysis, a transition state analog formed by GDP, tetrafluoroaluminate (AlF4 −, mimic of γ‐phosphate of GTP), and RasGAP (NF1GRD or p120GAP) was experimentally validated (Mittal et al. 1996). For Ras–RasGAP complex, the transition state of H‐Ras bound to p120GAP was solved (Scheffzek et al. 1997). In addition, crystal structures of the Rho family (Cdc42 and RhoA) bound to the RhoGAP were also determined in the ground OFF‐state and transition state, respectively (Rittinger et al. 1997a; Rittinger et al. 1997b). Previous studies identified the essential role of the arginine finger and Gln in the GTP hydrolysis (Bourne 1997), and recent theoretical studies focused on the molecular mechanism of the GTP hydrolysis (Calixto et al. 2020). Our simulations of the ground state of NF1GRD in complex with K‐Ras4B‐GTP, whose crystal structure in the transition state is unavailable, may provide structural insights into the conformational transition of the GAP‐stimulated GTP hydrolysis.
We superimposed the four crystal structures, including the ground OFF‐state of K‐Ras4B bound to NF1GRD (the starting structure used in this work), the transition state of H‐Ras bound to p120GAP, the ground OFF‐state of Cdc42 bound to RhoGAP, and the transition state of RhoA bound to RhoGAP (Figure 5a). In addition to the conserved arginine finger that stabilizes the active site of the transition state, one or two conserved salt bridges between Glu/Asp of Ras and Arg/Lys of GAP are also exhibited in both ground and transition states. In the case of H‐Ras bound with p120GAP, the salt bridge is formed between Glu63 and Arg903 (Figure 5c). Sequence alignment of the core region of NF1GRD with that of p120GAP shows that Arg903 is equivalent to Arg1391 in NF1GRD (Figure S8). In the transition state of RhoA bound to RhoGAP, interactions of Asp65 with both Lys122 and Arg126 are found to stabilize the conformation of Switch II (Figure 5d), and such interactions are also formed in the ground state of another member of the Rho family Cdc42 in which Asp63 interacts with both Lys122 and Arg126 simultaneously (Figure 5e). Consequently, the Gln63 of RhoA (or Gln61 of Cdc42) in Switch II becomes more ordered than its equivalent Gln61 in Ras (Rittinger et al. 1997b). Our structural analysis suggests that the Glu63–Arg1391 interaction plays a similar role in the stabilization of the conformation of Switch II of K‐Ras4B bound to NF1GRD, which facilitates Gln61 to position the hydrolytic water molecule for GAP‐activated GTP hydrolysis (Li and Zhang 2004). This conclusion is further supported by the experimental observation that NF1 R1391M mutant blocked the formation of the transition state analog (Mittal et al. 1996). Further, NF1 R1391A mutant decreased the GTP‐hydrolysis reaction 45‐fold, but R1391K substitute only decreased the reaction 2.4‐fold (Ahmadian et al. 1997). We therefore propose that the Glu63–Arg1391 interaction is a critical structural determinant for effective GTP hydrolysis stimulated by NF1GRD. To provide structural evidence, we calculated the root‐mean‐square‐fluctuation (RMSF) of K‐Ras4B for each system (Figure S9). Compared to the wild‐type NF1GRD, the E1356A mutant displayed larger fluctuations of residues neighboring Gln61, whereas the E1356V mutant displayed smaller fluctuations in the Switch II region. Consequently, the catalytic efficiency of the E1356A mutant could be lower than that of the wild‐type NF1GRD. In contrast, the catalytic efficiency of the E1356V mutant could be higher than that of the wild‐type NF1GRD. Therefore, compared to the wild‐type NF1, the E1356A mutant prefers to populate catalysis‐deficient conformations with diminished Glu63–Arg1391 interaction and thus more flexible Switch II region of K‐Ras4B, whereas the E1356V mutant efficiently populates the catalysis‐competent conformations with enhanced Glu63–Arg1391 interaction and consequently more stable Switch II region of K‐Ras4B. In addition, we also calculated the population of the Glu63–Arg1391 salt bridge in the cases of R1276P and R1276Q (Figure S10). Without the arginine finger, R1276Q shows a 3‐fold higher probability of establishing such a salt bridge as compared to R1276P, providing a rationale for the difference in the reduction of the NF1GRD GAP activity in R1276Q (~500‐fold) as compared to R1276P (~8000‐fold) (Ahmadian et al. 1997; Klose et al. 1998).
FIGURE 5.

The presence of salt bridge(s) in the binding interface between GTPases and their GAPs. (a) Superposition of the conformation of K‐Ras4B–NF1GRD complex in the ground OFF‐state (white, PDB ID: 6OB2), H‐Ras–p120GAP in the transition state (yellow, PDB ID: 1WQ1), RhoA–RhoGAP in the transition state (green, PDB ID: 1TX4), and Cdc42–RhoGAP in the ground OFF‐state (magenta, PDB ID: 1AM4). (b) The salt bridge Glu63–Arg1391 in the K‐Ras4B–NF1GRD complex. (c) The salt bridge Glu63–Arg903 in the H‐Ras–p120GAP complex. (d) The salt bridges Asp65–Lys122 and Asp65–Arg126 in the RhoA–RhoGAP complex. (e) The salt bridges Asp63–Lys122 and Asp63–Arg126 in the Cdc42–RhoGAP complex. The presence of salt bridge(s) near the catalytic Gln stabilizes the switch II of GTPases in both ground and transition states.
2.4. E1356 mutants allosterically modulate the Glu63–Arg1391 interaction
To further characterize how E1356 mutations allosterically modulate the Glu63–Arg1391 interaction, we performed dynamic network analysis implemented in VMD (Sethi et al. 2009), and constructed the optimal and suboptimal allosteric signal paths between Glu1356/Val1356NF1 and Glu63Ras, or between Ala1356NF1 and Arg1391NF1 (Figure 6a). For the complex comprising wild‐type NF1GRD, among the top five (one optimal and four suboptimal) allosteric signal paths propagating from Glu1356NF1 to Glu63Ras, we identified one suboptimal path (path 4) that involves Arg1391 and Glu63, indicating their correlated motion and consequently the formation of Glu63–Arg1391 salt bridge (Figures 6b and S11). Notably, four paths (paths 1, 2, 3, and 5) involve Glu62Ras and Lys1283NF1, showing that this stable salt bridge not only contributes to the active conformation of Switch II of K‐Ras4B but also transduces an allosteric signal from Glu1356NF1 to Glu63Ras. In the case of E1356A mutant, we could not identify any allosteric signal transmission between Ala1356NF1 and Glu63Ras that involve Arg1391NF1 in all signal paths, so we constructed the signal paths between Ala1356NF1 and Arg1391NF1. Again, there is no signal transfer path between Ala1356 and Arg1391 that involves Glu63 (Figures 6c and S11), indicating that E1356A mutation blocks the signal transmission between Glu63Ras and Arg1391NF1. Consequently, the formation of Glu63–Arg1391 salt bridge is greatly inhibited. By contrast, in the case of E1356V mutant, there are one optimal and three suboptimal signal paths that involve Arg1391NF1 and Glu63Ras (Figures 6d and S11), implying that E1356V mutation significantly enhances their correlated motion and therefore promotes the formation of the salt bridge between Arg1391NF1 and Glu63Ras. These distinct signal transduction paths suggest that E1356 mutations could allosterically modulate the Glu63–Arg1391 interaction, which in turn leads to distinct effects on the active conformation of Switch II in K‐Ras4B.
FIGURE 6.

Dynamic network analysis of the signal transfer path between E/A/V 1356 of NF1GRD and E63 of K‐Ras4B or R1391 of NF1GRD. (a) To identify the signal propagation pathway between NF1GRD and K‐Ras4B, we define the source residue is Glu1356/Ala1356/Val1356, and the sink residue is either Glu63 or Arg1391. (b) The signal propagation paths from Glu1356 of typeNF1GRD (wild type) to Glu63 of K‐Ras4B. (c) The signal propagation paths from Ala1356 of NF1GRD (E1356A) to Arg1391 NF1GRD. (d) The signal propagation paths from Val1356 of NF1GRD (E1356V) to Glu63 of K‐Ras4B. In all cases, the signal transfer paths include the optimal path (red, path 1) and four suboptimal paths (paths 2–5). For details, see Figure S11. The dynamic network analysis reveals that E1356 mutants allosterically modulate Glu63–Arg1391 interaction.
2.5. Insertion of exon 23a disrupts the active conformation of K‐Ras4B
We have demonstrated that mutations on E1356 of NF1GRD can allosterically modulate its GAP activity. Another structural alteration on NF1GRD is the insertion of 21 amino acids by exon 23a between Gln1370 and Val1371 (isoform 2, denoted as NF1GRD23a), which inhibits NF1 GAP activity (Hinman et al. 2014; Nguyen et al. 2017). To elucidate the underlying molecular mechanism, we constructed two structural models of NF1GRD23a in complex with K‐Ras4B‐GTP, where the insertion is initially either a random coil or a helix‐turn‐helix (Figure 7a). Note that the CHARMM36m force field used here is applicable for folded as well as intrinsically disordered structures (Huang et al. 2017). These two starting second structures represent two typical conformations as predicted by AlphaFold2 (Figure S12) (Jumper et al. 2021). We superimposed the two NF1GRD23a model structures with the GRD of the cryo‐electron microscopy structure of NF1 isoform 2 (PDB ID: 7PGT) and no steric clash with other domains were observed (Figure S13). Over a total of 3 μs MD simulations (1 μs each replica), the insertion can adopt primarily random coil structure or maintain partial helical structure in the Ala1371–Ala1380 fragment (Figure S14). The representative conformational dynamics of the two NF1GRD23a are shown in Figure S15.
FIGURE 7.

Modeling and characterization of the effect of exon 23a on the GAP activity of NF1GRD. (a) Sequence and initial conformations of the NF1GRD23a with the inserted 21 residues by alternative splicing of exon 23a in NF1 gene. The starting structure of the exon 23a is either random coil (in red circle, left panel) or helix‐turn‐helix (in red circle, right panel). The starting structure of K‐Ras4B is the same as shown in Figure 1. (b) The distances corresponding to the Mg2+ and GTP coordination, and between Arg1276 and GTP for NF1GRD23a in complex with K‐Ras4B. The initial structure of exon 23a is random coil. (c) The distances corresponding to the Mg2+ and GTP coordination, and between Arg1276 and GTP for NF1GRD23a in complex with K‐Ras4B. The initial structure of exon 23a is helix‐turn‐helix. (d) Representative conformation of the active site of K‐Ras4B, in which Thr35 no longer binds to Mg2+ and Gly60 no more binds to GTP even when Arg1276 interacts with the γ‐phosphate of GTP. (e) Superposition of the inactive conformations of K‐Ras4B bound to NF1GRD23a. The inactive conformations of K‐Ras4B with random coil and helix‐turn‐helix structures of exon 23a are colored green and magenta, respectively. For comparison, the active conformation of K‐Ras4B shown in Figure 3a (yellow), and the GDP‐bound K‐Ras4B in the inactive state 1 conformation (white, PDB ID: 6BP1) are also shown. The orientations of Tyr32 and Thr35 of K‐Ras4B are highlighted in the right panel. The insertion of exon 23a allosterically disrupts the active conformation of K‐Ras4B.
As we examined the coordination environment of the active site of K‐Ras4B bound to the NF1GRD without the insertion (Figure 2), we calculated the corresponding distances and found that the active conformation of K‐Ras4B was disrupted, independent of the insertion conformations (Figure 7b,c). The coordination of Mg2+ and GTP are not maintained in all simulations, suggesting that Switch I and Switch II of K‐Ras4B become more flexible. Figure 7d shows one such collapsed conformation in which Thr35 moved away from the active site, regardless of the interaction between Arg1276 of NF1 and the γ‐phosphate of GTP. We also performed clustering analysis on the conformational ensemble of NF1GRD23a in complex with K‐Ras4B and selected the representative conformations from the top one cluster for each system. We then superimposed these representative conformations with that of NF1GRD. For comparison, the inactive conformation of K‐Ras4B (state 1, PDB ID: 6BP1) taken from the crystal structure was also included in the superimposition (Figure 7e). Compared to the active conformation of K‐Ras4B, the conformations of both switches are more dynamic in the presence of the insertion, but still less dynamic than the experimentally determined inactive conformation of K‐Ras4B, in which the Switch I is more open, and Tyr32 and Thr35 move further away from the active site (Figure 7e). Nevertheless, the loss of stable coordination of Mg2+ and GTP due to the insertion on the NF1GRD renders K‐Ras4B unable to exert its catalytic activity properly.
The conformational dynamics shows that there exist interactions between the insertion and K‐Ras4B when the insertion adopts a helical structure (Figure S15). To characterize such interactions, we calculated the contact maps between NF1GRD23a and K‐Ras4B, as well as between the insertion and other part of NF1GRD23a (Figure S16). Weak to moderate interactions between the insertion and other part of NF1GRD23a are found when the insertion adopts a disordered conformation (Figure S16a), primarily between the lysine residues in the insertion (Lys1385, Lys1386, Lys1379, and Lys1389) and Glu/Asp (Asp1490, Asp1485, and Glu1220) in other part of NF1GRD23a. No direct interactions between the disordered insertion and K‐Ras4B were identified, thus the insertion seems to disrupt the active conformation of K‐Ras4B by an allosteric effect. However, when the insertion adopts a helix structure, in addition to the electrostatic interactions established between the lysine residues and other residues in NF1GRD23a, it can also form interactions with K‐Ras4B (Figure S16b–d). The interactions between the insertion (e.g., Lys1385 and Lys1386) and Switch I (e.g., Asp30 and Glu31) of K‐Ras4B seem to be responsible for the disruption of the coordination of Thr35 to Mg2+ as shown in Figure 7c. Also, the loss of binding between Gly60 and GTP indicates that the insertion allosterically disturbs the Switch II conformation of K‐Ras4B, regardless of the secondary structure the insertion adopts (Figure 7b,c). Collectively, our results demonstrate that the insertion on NF1GRD23a shifts K‐Ras4B population toward inactive conformations by allosteric regulation. And such regulation seems largely insensitive to mutations on NF1GRD23a as K‐Ras4B–NF1GRD23a complex harboring E1356V mutation persistently populates inactive conformation of K‐Ras4B (Figure S17).
3. DISCUSSION
NF1 is a multifunctional protein that regulates multiple signaling pathways including Ras/Raf/MEK/ERK and PI3K/AKT/mTOR (Baez‐Flores et al. 2023). As a RasGAP, NF1 catalyzes Ras‐mediated GTP hydrolysis, thus Ras/MAPK signaling (Bahar et al. 2023). Mutations on NF1 are associated with cutaneous neurofibromas, as well as developmental disorders (Ratner and Miller 2015). Most mutations are clearly loss‐of‐function alleles, especially missense mutations on NF1GRD (e.g., Arg1276 and Lys1423) that diminish GAP activity, supporting NF1 as a tumor suppressor (Vigil et al. 2010). Individuals carrying mutations at codons 844 to 848 exhibit severe phenotypes, including plexiform and symptomatic spinal neurofibromas, symptomatic optic pathway gliomas, other malignant neoplasms, and bone abnormalities (Koczkowska et al. 2018). These mutants, which are outside NF1GRD, act as dominant‐negative alleles by destabilizing the NF1 dimer (Young et al. 2023). Besides loss‐of‐function via dominant‐negative mechanisms, many pathogenic mutations also act via gain‐of‐function mechanism, with differential effects on protein structure (Gerasimavicius et al. 2022; Li et al. 2019), but have not been reported for NF1 mutations. Understanding the genotype–phenotype correlation has important implications for disease diagnosis and precision treatment (Leier et al. 2020; Nussinov et al. 2019; Zhou et al. 2021).
Here, we focused on the E1356A and E1356V mutants on NF1GRD, with the former related to neurofibromatosis and the latter associated with the neurodevelopmental disorder. Their pathogenicity predicted by AlphaMissense is considered benign, with a value of 0.118 for E1356A and 0.191 for E1356V (Cheng et al. 2023). But how these pathogenicity values relate to clinical outcomes, which can be severe, is unclear. In this work, we show that the two mutants have different effects on the conformational propensities of K‐Ras4B–NF1GRD complexes, which determines their distinct phenotypes. We show that both mutations have negligible impact on the active conformation of K‐Ras4B (Figure 2), which is also observed for mutations at the arginine finger Arg1276 (R1276P/Q) (Figure S1). For NF1GRD E1356A, there exists a higher energy barrier for the movement of Arg1276 into the active site of K‐Ras4B and interaction with the γ‐phosphate of GTP, suggesting that its conformational transition from the ground state to the transition state is kinetically less favorable than the wild‐type and E1356V mutant. Compared to the wild‐type NF1GRD, both mutants display similar properties in the active site that are preorganized for the GTP hydrolysis. However, the E1356V mutant exhibits a higher binding affinity to K‐Ras4B (Figure 3). Since the binding affinity between NF1GRD and K‐Ras4B is not directly correlated with the NF1 GAP activity (Figure S4), we analyzed the structural properties of different GTPases and their GAPs in the ground and transition states (Figure 5). We identified the Glu63–Arg1391 interaction as a critical determinant that stabilizes the transition states of NF1GRD‐catalyzed GTP hydrolysis. The presence of such an ionic interaction near the catalytic Gln at the Switch II region of GTPases seems a general structural arrangement provided by GTPases and their corresponding GAPs. In the case of GTPases Ras and Rho, the arginine finger is provided by the RasGAP and RhoGAP, respectively, but for the heterotrimeric G‐protein Giα1 in combination with RGS4 (a regulator of G‐protein signaling), the arginine finger is provided by G‐protein itself (Scheffzek et al. 1995). Although structurally different, such an ionic interaction at the binding interface that stabilizes the Switch II region (Gln in particular) of Giα1 is conserved (Figure S18). For GAP‐catalyzed GTP hydrolysis without an arginine finger, such as the nuclear Ras‐related protein (Ran), whose GTP hydrolysis requires both RanGAP and Ran‐binding protein RanBP1 or RanBP2 (Seewald et al. 2002). In the crystal structure of the ternary GMPPNP‐bound Ran–RanBP1–RanGAPyeast complex, there also exists such an ionic interaction between Lys71Ran and Asp103GAP at the binding interface between Ran and RanGAP (Figure S19). Sequence alignment and structural superposition showed that Lys71 of Ran is located at the Glu63 position of K‐Ras4B, and Gln69 of Ran is equivalent to Gln61 of K‐Ras4B (Scheffzek et al. 1995). Such an ionic interaction is conserved when Ran binds to human RanGAP in the presence of Ran binding protein, with Asp103 in yeast RanGAP equivalent to Asp121 of human RanGAP (Figure S20). The exact conformation of the intermediates in the transition state for GTP hydrolysis of the GTPase catalyzed by RasGAP remains unknown, and X‐ray crystal structures were resolved only for the transition state analogue in the presence of aluminum fluoride (Mittal et al. 1996; Scheffzek et al. 1997). Capturing more detailed conformational changes that occur as the Ras–RasGAP complex moves from the ground state to the transition state is beyond the capabilities of the classical MD simulations used in this study (van Gunsteren and Oostenbrink 2024). Time‐resolved Fourier transform infrared (tr‐FTIR) spectroscopy provides a high temporal and spatial resolution to monitor the kinetics of GAP‐mediated GTP hydrolysis by GTPases (Kotting et al. 2008; Rudack et al. 2012). The study of the GTPase reaction of the Ras−RasGAP by tr‐FTIR suggests that the movement of the arginine finger into the active site of Ras lowers the activation energy for the cleavage reaction (Kotting et al. 2008).
The catalytic efficiency of an enzyme reaction depends on the stabilization of the transition state in a very specific arrangement (Schramm 1998). The ground state conformations of K‐Ras4B–NF1GRD complex in our simulations resemble the near attack conformation (NAC), which is defined as the required conformation for juxtaposed reactants to enter a transition state (Lightstone and Bruice 1996). A greater fraction of reactant conformations that are present as NACs corresponds to a greater rate constant (Bruice and Lightstone 1999). A NAC is still a ground state conformation where bond breaking and forming have not been initiated, but reactants have been properly aligned at 1–3 Å separation for the reaction (Bruice and Lightstone 1999). As we show, both wild‐type and E1356‐mutated complexes are structurally prepared for the GTP hydrolysis (Figure 3), except for Gln61 that has not orientated the nucleophilic water for reaction (Figure S5). Notably, compared to the wild‐type, the NF1GRD E1356V mutant populates more NACs with enhanced Glu63–Arg1391 interaction that stabilize Glu61 position at the Switch II region of K‐Ras4B (Figure 4). Therefore, the NF1GRD E1356V mutant appears more catalytically efficient than the NF1GRD E1356A mutant. NF1 forms a high‐affinity dimer in human cells (Sherekar et al. 2020). Based on the cryo‐electron microscopy structure of NF1 dimer (PDB ID: 7R04) (Chaker‐Margot et al. 2022), E1356 has a few contacts with several residues at the C‐HEAT domain in the closed conformation of GRD. However, the contacting interface is mostly exposed, and thus these contacts may not impair the dimer stability. Meanwhile, E1356 has no contact with other domains in the open conformation of GRD (Figure S21). Therefore, the E1356 mutation could not exert a dominant‐negative effect. Due to the distinct conformational propensities, the NF1GRD E1356V mutant is more likely to act through a gain‐of‐function mechanism, whereas the NF1GRD E1356A mutant acts via a loss‐of‐function mechanism. Like E1356A, we also found that NF1GRD E1356G mutant acts through a loss‐of‐function mechanism (Figure S22).
Like gain‐of‐function mutations in SHP2 that promote Noonan syndrome (NS) by enhanced activation of the Ras/MAPK pathway (Araki et al. 2009; Neel et al. 2003), some NF1 patients demonstrate neurofibromatosis‐Noonan syndrome (NFNS) with phenotypic features of both neurofibromatosis type I and NS (De Luca et al. 2005). Notably, there is a high prevalence of defects affecting NF1GRD in NFNS, including E1415X (truncating), K1423E, N1430T, V1432L, and E1438del (in‐frame deletion) (De Luca et al. 2005). Among these defects, K1423E in NF1GRD disrupts the Asp38–Lys1423 salt bridge that helps stabilize Switch I of K‐Ras4B (Figure 4), and thus acts as a loss‐of‐function mutation. This is consistent with early experimental data showing that K1423E mutant occurred in NF1 and severely impaired the GAP activity of NF1GRD (Li et al. 1992). In addition to mutations at Arg1276 and Glu1356, we further elucidate the molecular mechanism of how the alternative splicing of NF1 exon 23a diminishes the GAP activity of NF1GRD primarily allosterically (Figure 7). Exon 23a inserts 21 residues in NF1GRD, including six lysine and two glutamic acid residues, significantly altering NF1GRD total charge and its conformational dynamics, which in turn allosterically impairs the active conformation of the bound K‐Ras4B. This result is in line with the experimental results showing that the isolated NF1GRD has a low conformational stability and is sensitive to pH changes of the solution (Neira et al. 2021). Our study thus provides a structural basis for the inhibitory effect of exon 23a on the GAP activity of NF1GRD, and consequently a significant increase in Ras/MAPK signaling that impairs learning behaviors in mice (Hinman et al. 2014; Nguyen et al. 2017). On the other hand, the increased RasGAP activity of NF1GRD due to E1356V may attenuate Ras/MAPK signaling, which also contributes to the neurodevelopmental disorders (Iroegbu et al. 2021). Normal “central nervous system” development requires a balanced cellular Ras/MAPK signaling (Iroegbu et al. 2021).
Deregulation of NF1 and other RasGAPs has been associated with a variety of cancers (Maertens and Cichowski 2014; Mishra and Lambright 2016). NF1 mutations are also highly related to developmental learning disabilities (Iroegbu et al. 2021; Shilyansky et al. 2010). They were classically considered as regulatory proteins but not druggable targets (Maertens and Cichowski 2014; Sran and Bedrosian 2023; Vigil et al. 2010). With pharmacological advances that however may change. Most Ras oncogenic mutations at Gly12, Gly13, or Gln61 may prevent the formation of the Ras–GAP transition state, thereby blocking RasGAP‐catalyzed GTP hydrolysis (Scheffzek et al. 1997). The K‐Ras4B G13D mutation, however, was shown to respond to NF1GRD‐mediated GTP hydrolysis (Rabara et al. 2019). Another K‐Ras4B mutation G12C, which is insensitive to RasGAPs, can hydrolyze GTP in the presence of RGS3. In addition, RGS3 also enhanced GTP hydrolysis by K‐Ras4B G12D/V and G13C/D mutants, but less effectively than NF1 or p120GAP (Li et al. 2021). Thus, restoring the GAP activity emerges as a new, albeit indirect, strategy to target specific Ras mutations. A recent QM/MM study implied that R903E is the most promising mutant of p120GAP for decreasing the activation barrier of the G12D Ras–GAP complex (Berta et al. 2023). We note that with Arg903 of p120GAP being equivalent to Arg1391 of NF1GRD (Figure S8), the above QM/MM result is consistent with our present results showing that formation of the Glu63–Arg1391 salt bridge promotes the catalysis‐ready conformation of NF1GRD mutant E1356V. As R1391E of NF1GRD would disrupt the salt bridge with Glu63 of K‐Ras4B, our results suggest that E1356V is a promising allosteric mutant for targeting K‐Ras4B G12D mutant through enhancing NF1 GAP activity.
4. CONCLUSIONS
NF1 is an essential negative regulator of Ras‐driven oncogenesis owing to its GAP function. In addition to the loss‐of‐function and dominant‐negative mutations identified in NF1 gene, we decipher the molecular mechanism of the gain‐of‐function mutant E1356V on NF1GRD, which to date is the only mutation identified on NF1GRD associated with neurodevelopmental disorders. Our results suggest that NF1 GAP is allosterically regulated, offering novel structural insights into the activation of the NF1GRD to target K‐Ras4B oncogenic driver mutations. We demonstrate that the differential conformational propensities of E1356A and E1356V NF1GRD determine their distinct clinical phenotypes (neurofibromatosis or neurodevelopmental disorder), within the framework of our hypothesis, that is, that stronger, cancer‐associated mutants harbor a higher propensity of active conformations than the weaker, neurodevelopmental‐related variants (Nussinov et al. 2022; Nussinov et al. 2023a; Nussinov et al. 2023b). A high population of the active state is a requirement for cell proliferation, which is a hallmark of cancer. Weaker, neurodevelopmental disorders‐related variants are associated with cell growth in differentiation. We further provide the structural basis for the allosteric modulation of the NF1GRD GAP by exon 23a, whose loss‐of‐function alteration in NF1GRD impairs learning behaviors in mice (Hinman et al. 2014; Nguyen et al. 2017).
Taken together, we provide a genotype‐ensembles‐phenotype correlation for NF1 mutations, in line with our tenet of sequence‐conformational ensemble‐function replacing the sequence‐structure‐function paradigm (Nussinov et al. 2023b). Our blueprint would need to be expanded for precision therapy. This approach could be envisioned as akin to experimental energetic and allosteric landscapes of mutations, as executed for several proteins, including K‐Ras (Weng et al. 2024), H‐Ras (Hidalgo et al. 2022), and Src (Hobbs et al. 2022). Propensities of conformational ensembles are powerful predictors of protein function. Coupled with computational deep high‐throughput mining and comprehensive mapping of allosteric protein landscapes (Verkhivker et al. 2023), and performed comprehensively across mutational landscapes, they can help decipher the intricate mechanisms driving pathogenesis and target them. They may also help perceiving the differential functional outcomes of multiple ligands binding to a receptor, as in the case of RTKs (Karl et al. 2024; Krzyscik et al. 2024; Wirth et al. 2023; Wirth et al. 2024), even if the change is too small to be observable experimentally. They can also couple with strategies such as the recently offered, powerful prediction of high‐throughput mutational scans (Sora et al. 2023). We hope that the concept and approach presented here contributes toward this aim.
5. MATERIALS AND METHODS
5.1. Modeling of NF1GRD in complex with GTP‐bound K‐Ras4B
The crystal structure of wild‐type K‐Ras4B (GMPPNP‐bound) in complex with the GRD of NF1 (PDB ID: 6OB2) (Rabara et al. 2019) was used to construct the initial structural model. The nonhydrolyzable GTP analog GMPPNP was converted into the GTP by replacing the secondary amine group bridging the β‐phosphate to the γ‐phosphate with the oxygen atom. The initial GRD model (residues 1219–1462) contains the minimal central catalytic domain of NF1 (GAPc, residues 1248–1477), which exhibits full GAP activity (Ahmadian et al. 1996). In addition to GAPc, the GRD contains an extra domain (GAPex) at both ends of GAPc formed by the N‐ and C‐terminus that can bind to Spred1 (Sprouty‐related, EVH1 domain‐containing protein 1) without affecting the catalytic activity of NF1 (Dunzendorfer‐Matt et al. 2016). Recent simulation study suggested that the binding of Spred1 allosterically enhanced the binding between K‐Ras4B and NF1GRD, but impeded the conformational transformation of the catalytic center (Li et al. 2022). We adopted the GAPex conformation from the crystal structure of NF1GRD (residues 1205–1528) in complex with Spred1 and GMPPNP‐bound K‐Ras4B (PDB ID: 6V65) (Yan et al. 2020) by superimposing 6OB2 with respect to the GRD. Other missing residues were modeled using the Rosetta loop modeling and refinement methods (Leman et al. 2020). Our initial model complex for MD simulations contains the wild‐type NF1GRD (residues 1205–1530) and the GTP‐bound K‐Ras4B (residues 1–169) (Figure 1a). The NF1GRD mutants (R1276P/Q and E1356A/V) were generated using the CHARMM program (version 46b1) (Brooks et al. 1983).
5.2. MD simulation protocol
All MD simulations were performed with NAMD 2.14 (Phillips et al. 2005; Phillips et al. 2020). The simulation protocols were similar to those used in our previous works (Jang et al. 2021; Liu et al. 2022a; Liu et al. 2022b; Liu et al. 2023a; Liu et al. 2024; Maloney et al. 2021; Zhang et al. 2019; Zhang et al. 2021; Zhang et al. 2024a; Zhang et al. 2024b). Each complex structure was represented using the updated and modified version of the CHARMM36m force field parameters (Huang et al. 2017; Klauda et al. 2010) and solved in a cubic water box filled with TIP3P water molecules. The minimum distance between the protein and the edge of the water box was 12 Å. Each system was neutralized by adding 100 mM NaCl. The Nosé‐Hoover Langevin piston pressure control and Langevin temperature control were used to maintain the pressure at 1 atm and the temperature at 310 K (Braga and Travis 2005; Martyna et al. 1994). Long‐range electrostatics were treated using the Particle Mesh Ewald (PME) method (Darden et al. 1993), with the PME grid spacing of 1.0 Å and PME interpolation order of 6. The van der Waals (vdW) interactions were calculated using a switching function with a twin cutoff of 10 Å and 12 Å, and the SHAKE algorithm was applied to constrain the motion of bonds involving hydrogen atoms (Ciccotti and Ryckaert 1986). An integration time step of 2 fs was used for all simulations. Each system was first energy minimized for 20,000 steps, and then equilibrated in the NVT ensemble (constant volume and temperature at 310 K) for 5 ns with Cα atoms of protein, GTP, and Mg2+ restrained using harmonic restraints. The production run was performed in the NPT ensemble (constant pressure at 1 atm and temperature at 310 K) without any restraints and lasted for 1 μs. Three independent simulations were performed for each system, and statistical data were obtained by averaging the last half of each independent simulation for each system.
5.3. Binding free energy calculation
The binding free energy between NF1GRD and K‐Ras4B‐GTP was evaluated in terms of the molecular mechanics energies combined with generalized Born and surface area solvation (MM/GBSA) method (Genheden and Ryde 2015; Wang et al. 2019). The averaged binding free energy is calculated as a sum of the gas‐phase molecular mechanics energy , the solvation energy contribution , and the entropy contribution –TΔS,
where angle bracket denotes an average along the MD trajectory. The gas‐phase molecular mechanics energy is a sum of the internal energy, the electrostatic energy, and the vdW interaction energy,
The solvation energy contribution can be divided into the electrostatic contribution and the nonpolar contribution,
where the electrostatic contribution was calculated using the generalized Born model (Onufriev et al. 2004). The nonpolar contribution is obtained using an equation
where SASA denotes the solvent‐accessible surface area (Wang and Kollman 2000), with a set of the surface tension parameters, γ = 0.00542 and the constant β = 0.92.
The entropy contribution, TΔS, to the binding free energy was calculated by normal model analysis (Srinivasan et al. 1998). The gas‐phase, solvation energy, and entropy contributions were calculated based on a set of conformational snapshots taken from the MD simulations. A total of 2000 snapshots taken from the last half of each simulation were used to calculate the gas‐phase and solvation energy contributions, whereas a total of 50 snapshots were used to calculate the entropy contribution due to its heavy computational cost. Finally, the change in binding free energy due to the complex formation is calculated using the equation,
The molecular interconversion program ParmEd was used to convert CHARMM topology files into Amber input format (Shirts et al. 2017). The binding free energy was calculated using the Perl script mm_pbsa.pl with default parameters in Amber22 program (Case et al. 2023).
AUTHOR CONTRIBUTIONS
Liang Xu: Methodology; formal analysis; conceptualization; data curation; writing – original draft; software. Hyunbum Jang: Conceptualization; methodology; writing – review and editing; software. Ruth Nussinov: Conceptualization; funding acquisition; project administration; supervision; writing – review and editing.
CONFLICT OF INTEREST STATEMENT
The authors declare no conflicts of interest.
Supporting information
Data S1. Supporting Information.
ACKNOWLEDGMENTS
This project has been funded in whole or in part with federal funds from the National Cancer Institute, National Institutes of Health, under contract HHSN261201500003I. The content of this publication does not necessarily reflect the views or policies of the Department of Health and Human Services, nor does mention of trade names, commercial products, or organizations imply endorsement by the US Government. This research was supported [in part] by the Intramural Research Program of the NIH, National Cancer Institute, Center for Cancer Research. All simulations were performed using the high‐performance computational facilities of the Biowulf PC/Linux cluster at the National Institutes of Health, Bethesda, MD (https://hpc.nih.gov/).
Xu L, Jang H, Nussinov R. Allosteric modulation of NF1 GAP: Differential distributions of catalytically competent populations in loss‐of‐function and gain‐of‐function mutants. Protein Science. 2025;34(2):e70042. 10.1002/pro.70042
Review Editor: Lynn Kamerlin
DATA AVAILABILITY STATEMENT
The data that support the findings of this study are available from the corresponding author upon reasonable request.
REFERENCES
- Ahmadian MR, Stege P, Scheffzek K, Wittinghofer A. Confirmation of the arginine‐finger hypothesis for the GAP‐stimulated GTP‐hydrolysis reaction of Ras. Nat Struct Biol. 1997;4:686–689. [DOI] [PubMed] [Google Scholar]
- Ahmadian MR, Wiesmuller L, Lautwein A, Bischoff FR, Wittinghofer A. Structural differences in the minimal catalytic domains of the GTPase‐activating proteins p120GAP and neurofibromin. J Biol Chem. 1996;271:16409–16415. [DOI] [PubMed] [Google Scholar]
- Akimoto M, Martinez Pomier K, VanSchouwen B, Byun JA, Khamina M, Melacini G. Allosteric pluripotency: challenges and opportunities. Biochem J. 2022;479:825–838. [DOI] [PubMed] [Google Scholar]
- Andersen LB, Ballester R, Marchuk DA, Chang E, Gutmann DH, Saulino AM, et al. A conserved alternative splice in the von Recklinghausen neurofibromatosis (NF1) gene produces two neurofibromin isoforms, both of which have GTPase‐activating protein activity. Mol Cell Biol. 1993;13:487–495. [DOI] [PMC free article] [PubMed] [Google Scholar]
- Araki T, Chan G, Newbigging S, Morikawa L, Bronson RT, Neel BG. Noonan syndrome cardiac defects are caused by PTPN11 acting in endocardium to enhance endocardial‐mesenchymal transformation. Proc Natl Acad Sci U S A. 2009;106:4736–4741. [DOI] [PMC free article] [PubMed] [Google Scholar]
- Baez‐Flores J, Rodriguez‐Martin M, Lacal J. The therapeutic potential of neurofibromin signaling pathways and binding partners. Commun Biol. 2023;6:436. [DOI] [PMC free article] [PubMed] [Google Scholar]
- Bahar ME, Kim HJ, Kim DR. Targeting the RAS/RAF/MAPK pathway for cancer therapy: from mechanism to clinical studies. Signal Transduct Target Ther. 2023;8:455. [DOI] [PMC free article] [PubMed] [Google Scholar]
- Berta D, Gehrke S, Nyiri K, Vertessy BG, Rosta E. Mechanism‐based redesign of GAP to activate oncogenic Ras. J Am Chem Soc. 2023;145:20302–20310. [DOI] [PMC free article] [PubMed] [Google Scholar]
- Bourne HR. G proteins. The arginine finger strikes again. Nature. 1997;389:673–674. [DOI] [PubMed] [Google Scholar]
- Braga C, Travis KP. A configurational temperature nose‐hoover thermostat. J Chem Phys. 2005;123:134101. [DOI] [PubMed] [Google Scholar]
- Brooks BR, Bruccoleri RE, Olafson BD, States DJ, Swaminathan S, Karplus M. Charmm—a program for macromolecular energy, minimization, and dynamics calculations. J Comput Chem. 1983;4:187–217. [Google Scholar]
- Bruice TC, Lightstone FC. Ground state and transition state contributions to the rates of intramolecular and enzymatic reactions. Accounts Chem Res. 1999;32:127–136. [Google Scholar]
- Byun JA, VanSchouwen B, Akimoto M, Melacini G. Allosteric inhibition explained through conformational ensembles sampling distinct “mixed” states. Comput Struct Biotechnol J. 2020;18:3803–3818. [DOI] [PMC free article] [PubMed] [Google Scholar]
- Calixto AR, Moreira C, Kamerlin SCL. Recent advances in understanding biological GTP hydrolysis through molecular simulation. ACS Omega. 2020;5:4380–4385. [DOI] [PMC free article] [PubMed] [Google Scholar]
- Calixto AR, Moreira C, Pabis A, Kotting C, Gerwert K, Rudack T, et al. GTP hydrolysis without an active site base: a unifying mechanism for Ras and related GTPases. J Am Chem Soc. 2019;141:10684–10701. [DOI] [PubMed] [Google Scholar]
- Case DA, Aktulga HM, Belfon K, Ben‐Shalom IY, Berryman JT, Brozell SR, et al. Amber 2023. San Francisco, CA: University of California, San Francisco; 2023. [Google Scholar]
- Chaker‐Margot M, Werten S, Dunzendorfer‐Matt T, Lechner S, Ruepp A, Scheffzek K, et al. Structural basis of activation of the tumor suppressor protein neurofibromin. Mol Cell. 2022;82:1288–1296.e5. [DOI] [PubMed] [Google Scholar]
- Cheng J, Novati G, Pan J, Bycroft C, Zemgulyte A, Applebaum T, et al. Accurate proteome‐wide missense variant effect prediction with AlphaMissense. Science. 2023;381:eadg7492. [DOI] [PubMed] [Google Scholar]
- Ciccotti G, Ryckaert JP. Molecular‐dynamics simulation of rigid molecules. Comput Phys Rep. 1986;4:345–392. [Google Scholar]
- Cui Y, Costa RM, Murphy GG, Elgersma Y, Zhu Y, Gutmann DH, et al. Neurofibromin regulation of ERK signaling modulates GABA release and learning. Cell. 2008;135:549–560. [DOI] [PMC free article] [PubMed] [Google Scholar]
- Darden T, York D, Pedersen L. Particle Mesh Ewald—an N.Log(N) method for Ewald sums in large systems. J Chem Phys. 1993;98:10089–10092. [Google Scholar]
- De Luca A, Bottillo I, Sarkozy A, Carta C, Neri C, Bellacchio E, et al. NF1 gene mutations represent the major molecular event underlying neurofibromatosis‐Noonan syndrome. Am J Hum Genet. 2005;77:1092–1101. [DOI] [PMC free article] [PubMed] [Google Scholar]
- Deciphering Developmental Disorders Study . Prevalence and architecture of de novo mutations in developmental disorders. Nature. 2017;542:433–438. [DOI] [PMC free article] [PubMed] [Google Scholar]
- Dunzendorfer‐Matt T, Mercado EL, Maly K, McCormick F, Scheffzek K. The neurofibromin recruitment factor Spred1 binds to the GAP related domain without affecting Ras inactivation. Proc Natl Acad Sci U S A. 2016;113:7497–7502. [DOI] [PMC free article] [PubMed] [Google Scholar]
- Durrant JD, de Oliveira CAF, McCammon JA. POVME: an algorithm for measuring binding‐pocket volumes. J Mol Graph Model. 2011;29:773–776. [DOI] [PMC free article] [PubMed] [Google Scholar]
- Durrant JD, Votapka L, Sorensen J, Amaro RE. POVME 2.0: an enhanced tool for determining pocket shape and volume characteristics. J Chem Theory Comput. 2014;10:5047–5056. [DOI] [PMC free article] [PubMed] [Google Scholar]
- Fahsold R, Hoffmeyer S, Mischung C, Gille C, Ehlers C, Kucukceylan N, et al. Minor lesion mutational spectrum of the entire NF1 gene does not explain its high mutability but points to a functional domain upstream of the GAP‐related domain. Am J Hum Genet. 2000;66:790–818. [DOI] [PMC free article] [PubMed] [Google Scholar]
- Friedman JM, Arbiser J, Epstein JA, Gutmann DH, Huot SJ, Lin AE, et al. Cardiovascular disease in neurofibromatosis 1: report of the NF1 cardiovascular task force. Genet Med. 2002;4:105–111. [DOI] [PubMed] [Google Scholar]
- Genheden S, Ryde U. The MM/PBSA and MM/GBSA methods to estimate ligand‐binding affinities. Expert Opin Drug Discovery. 2015;10:449–461. [DOI] [PMC free article] [PubMed] [Google Scholar]
- Gerasimavicius L, Livesey BJ, Marsh JA. Loss‐of‐function, gain‐of‐function and dominant‐negative mutations have profoundly different effects on protein structure. Nat Commun. 2022;13:3895. [DOI] [PMC free article] [PubMed] [Google Scholar]
- Gutmann DH, Wood DL, Collins FS. Identification of the neurofibromatosis type 1 gene product. Proc Natl Acad Sci U S A. 1991;88:9658–9662. [DOI] [PMC free article] [PubMed] [Google Scholar]
- Hidalgo F, Nocka LM, Shah NH, Gorday K, Latorraca NR, Bandaru P, et al. A saturation‐mutagenesis analysis of the interplay between stability and activation in Ras. eLife. 2022;11:e76595. [DOI] [PMC free article] [PubMed] [Google Scholar]
- Hinman MN, Sharma A, Luo G, Lou H. Neurofibromatosis type 1 alternative splicing is a key regulator of Ras signaling in neurons. Mol Cell Biol. 2014;34:2188–2197. [DOI] [PMC free article] [PubMed] [Google Scholar]
- Hobbs HT, Shah NH, Shoemaker SR, Amacher JF, Marqusee S, Kuriyan J. Saturation mutagenesis of a predicted ancestral Syk‐family kinase. Protein Sci. 2022;31:e4411. [DOI] [PMC free article] [PubMed] [Google Scholar]
- Huang J, Rauscher S, Nawrocki G, Ran T, Feig M, de Groot BL, et al. CHARMM36m: an improved force field for folded and intrinsically disordered proteins. Nat Methods. 2017;14:71–73. [DOI] [PMC free article] [PubMed] [Google Scholar]
- Iroegbu JD, Ijomone OK, Femi‐Akinlosotu OM, Ijomone OM. ERK/MAPK signalling in the developing brain: perturbations and consequences. Neurosci Biobehav Rev. 2021;131:792–805. [DOI] [PubMed] [Google Scholar]
- Jang H, Chen J, Iakoucheva LM, Nussinov R. Cancer and autism: how PTEN mutations degrade function at the membrane and isoform expression in the human brain. J Mol Biol. 2023;435:168354. [DOI] [PMC free article] [PubMed] [Google Scholar]
- Jang H, Smith IN, Eng C, Nussinov R. The mechanism of full activation of tumor suppressor PTEN at the phosphoinositide‐enriched membrane. iScience. 2021;24:102438. [DOI] [PMC free article] [PubMed] [Google Scholar]
- Jumper J, Evans R, Pritzel A, Green T, Figurnov M, Ronneberger O, et al. Highly accurate protein structure prediction with AlphaFold. Nature. 2021;596:583–589. [DOI] [PMC free article] [PubMed] [Google Scholar]
- Karl K, Del Piccolo N, Light T, Roy T, Dudeja P, Ursachi VC, et al. Ligand bias underlies differential signaling of multiple FGFs via FGFR1. eLife. 2024;12:RP88144. [DOI] [PMC free article] [PubMed] [Google Scholar]
- Kelley LA, Gardner SP, Sutcliffe MJ. An automated approach for clustering an ensemble of NMR‐derived protein structures into conformationally related subfamilies. Protein Eng. 1996;9:1063–1065. [DOI] [PubMed] [Google Scholar]
- Kiuru M, Busam KJ. The NF1 gene in tumor syndromes and melanoma. Lab Invest. 2017;97:146–157. [DOI] [PMC free article] [PubMed] [Google Scholar]
- Klauda JB, Venable RM, Freites JA, O'Connor JW, Tobias DJ, Mondragon‐Ramirez C, et al. Update of the CHARMM all‐atom additive force field for lipids: validation on six lipid types. J Phys Chem B. 2010;114:7830–7843. [DOI] [PMC free article] [PubMed] [Google Scholar]
- Klose A, Ahmadian MR, Schuelke M, Scheffzek K, Hoffmeyer S, Gewies A, et al. Selective disactivation of neurofibromin GAP activity in neurofibromatosis type 1. Hum Mol Genet. 1998;7:1261–1268. [DOI] [PubMed] [Google Scholar]
- Koczkowska M, Chen Y, Callens T, Gomes A, Sharp A, Johnson S, et al. Genotype‐phenotype correlation in NF1: evidence for a more severe phenotype associated with missense mutations affecting NF1 codons 844‐848. Am J Hum Genet. 2018;102:69–87. [DOI] [PMC free article] [PubMed] [Google Scholar]
- Kolch W, Berta D, Rosta E. Dynamic regulation of RAS and RAS signaling. Biochem J. 2023;480:1–23. [DOI] [PMC free article] [PubMed] [Google Scholar]
- Kotting C, Kallenbach A, Suveyzdis Y, Wittinghofer A, Gerwert K. The GAP arginine finger movement into the catalytic site of Ras increases the activation entropy. Proc Natl Acad Sci U S A. 2008;105:6260–6265. [DOI] [PMC free article] [PubMed] [Google Scholar]
- Krzyscik MA, Karl K, Dudeja P, Krejci P, Hristova K. Quantitative and qualitative differences in the activation of a fibroblast growth factor receptor by different FGF ligands. Cytokine Growth Factor Rev. 2024;78:77–84. [DOI] [PMC free article] [PubMed] [Google Scholar]
- Landrum MJ, Lee JM, Riley GR, Jang W, Rubinstein WS, Church DM, et al. ClinVar: public archive of relationships among sequence variation and human phenotype. Nucleic Acids Res. 2014;42:D980–D985. [DOI] [PMC free article] [PubMed] [Google Scholar]
- Leier A, Bedwell DM, Chen AT, Dickson G, Keeling KM, Kesterson RA, et al. Mutation‐directed therapeutics for neurofibromatosis type I. Mol Ther Nucleic Acids. 2020;20:739–753. [DOI] [PMC free article] [PubMed] [Google Scholar]
- Leman JK, Weitzner BD, Lewis SM, Adolf‐Bryfogle J, Alam N, Alford RF, et al. Macromolecular modeling and design in Rosetta: recent methods and frameworks. Nat Methods. 2020;17:665–680. [DOI] [PMC free article] [PubMed] [Google Scholar]
- Li C, Vides A, Kim D, Xue JY, Zhao Y, Lito P. The G protein signaling regulator RGS3 enhances the GTPase activity of KRAS. Science. 2021;374:197–201. [DOI] [PMC free article] [PubMed] [Google Scholar]
- Li G, Zhang XC. GTP hydrolysis mechanism of Ras‐like GTPases. J Mol Biol. 2004;340:921–932. [DOI] [PubMed] [Google Scholar]
- Li M, Wang Y, Fan J, Zhuang H, Liu Y, Ji D, et al. Mechanistic insights into the long‐range allosteric regulation of KRAS via neurofibromatosis type 1 (NF1) scaffold upon SPRED1 loading. J Mol Biol. 2022;434:167730. [DOI] [PubMed] [Google Scholar]
- Li Y, Bollag G, Clark R, Stevens J, Conroy L, Fults D, et al. Somatic mutations in the neurofibromatosis 1 gene in human tumors. Cell. 1992;69:275–281. [DOI] [PubMed] [Google Scholar]
- Li Y, Zhang Y, Grosseruschkamp F, Stephan S, Cui Q, Kotting C, et al. Specific substates of Ras to interact with GAPs and effectors: revealed by theoretical simulations and FTIR experiments. J Phys Chem Lett. 2018;9:1312–1317. [DOI] [PMC free article] [PubMed] [Google Scholar]
- Li Y, Zhang Y, Li X, Yi S, Xu J. Gain‐of‐function mutations: an emerging advantage for cancer biology. Trends Biochem Sci. 2019;44:659–674. [DOI] [PMC free article] [PubMed] [Google Scholar]
- Lightstone FC, Bruice TC. Ground state conformations and entropic and enthalpic factors in the efficiency of intramolecular and enzymatic reactions. 1. Cyclic anhydride formation by substituted glutarates, succinate, and 3,6‐endoxo‐Delta(4)‐tetrahydrophthalate monophenyl esters. J Am Chem Soc. 1996;118:2595–2605. [Google Scholar]
- Lin Y, Ramelot TA, Senyuz S, Gursoy A, Jang H, Nussinov R, et al. Tumor‐derived RHOA mutants interact with effectors in the GDP‐bound state. Nat Commun. 2024;15:7176. [DOI] [PMC free article] [PubMed] [Google Scholar]
- Liu Y, Jang H, Zhang M, Tsai CJ, Maloney R, Nussinov R. The structural basis of BCR‐ABL recruitment of GRB2 in chronic myelogenous leukemia. Biophys J. 2022a;121:2251–2265. [DOI] [PMC free article] [PubMed] [Google Scholar]
- Liu Y, Zhang M, Jang H, Nussinov R. Higher‐order interactions of Bcr‐Abl can broaden chronic myeloid leukemia (CML) drug repertoire. Protein Sci. 2023a;32:e4504. [DOI] [PMC free article] [PubMed] [Google Scholar]
- Liu Y, Zhang M, Jang H, Nussinov R. The allosteric mechanism of mTOR activation can inform bitopic inhibitor optimization. Chem Sci. 2024;15:1003–1017. [DOI] [PMC free article] [PubMed] [Google Scholar]
- Liu Y, Zhang M, Tsai CJ, Jang H, Nussinov R. Allosteric regulation of autoinhibition and activation of c‐Abl. Comput Struct Biotechnol J. 2022b;20:4257–4270. [DOI] [PMC free article] [PubMed] [Google Scholar]
- Liu Y, Zhang W, Jang H, Nussinov R. SHP2 clinical phenotype, cancer, or RASopathies, can be predicted by mutant conformational propensities. Cell Mol Life Sci. 2023b;81:5. [DOI] [PMC free article] [PubMed] [Google Scholar]
- Maertens O, Cichowski K. An expanding role for RAS GTPase activating proteins (RAS GAPs) in cancer. Adv Biol Regul. 2014;55:1–14. [DOI] [PubMed] [Google Scholar]
- Maloney RC, Zhang M, Jang H, Nussinov R. The mechanism of activation of monomeric B‐Raf V600E. Comput Struct Biotechnol J. 2021;19:3349–3363. [DOI] [PMC free article] [PubMed] [Google Scholar]
- Martin‐Garcia F, Mendieta‐Moreno JI, Lopez‐Vinas E, Gomez‐Puertas P, Mendieta J. The role of Gln61 in HRas GTP hydrolysis: a quantum mechanics/molecular mechanics study. Biophys J. 2012;102:152–157. [DOI] [PMC free article] [PubMed] [Google Scholar]
- Martyna GJ, Tobias DJ, Klein ML. Constant‐pressure molecular‐dynamics algorithms. J Chem Phys. 1994;101:4177–4189. [Google Scholar]
- Matsumoto S, Miyano N, Baba S, Liao J, Kawamura T, Tsuda C, et al. Molecular mechanism for conformational dynamics of Ras. GTP elucidated from in‐situ structural transition in crystal. Sci Rep. 2016;6:25931. [DOI] [PMC free article] [PubMed] [Google Scholar]
- Mishra AK, Lambright DG. Invited review: small GTPases and their GAPs. Biopolymers. 2016;105:431–448. [DOI] [PMC free article] [PubMed] [Google Scholar]
- Mittal R, Ahmadian MR, Goody RS, Wittinghofer A. Formation of a transition‐state analog of the Ras GTPase reaction by Ras‐GDP, tetrafluoroaluminate, and GTPase‐activating proteins. Science. 1996;273:115–117. [DOI] [PubMed] [Google Scholar]
- Neel BG, Gu H, Pao L. The Shping news: SH2 domain‐containing tyrosine phosphatases in cell signaling. Trends Biochem Sci. 2003;28:284–293. [DOI] [PubMed] [Google Scholar]
- Neira JL, Vega S, Martinez‐Rodriguez S, Velazquez‐Campoy A. The isolated GTPase‐activating‐protein‐related domain of neurofibromin‐1 has a low conformational stability in solution. Arch Biochem Biophys. 2021;700:108767. [DOI] [PubMed] [Google Scholar]
- Nguyen HT, Hinman MN, Guo X, Sharma A, Arakawa H, Luo G, et al. Neurofibromatosis type 1 alternative splicing is a key regulator of Ras/ERK signaling and learning behaviors in mice. Hum Mol Genet. 2017;26:3797–3807. [DOI] [PMC free article] [PubMed] [Google Scholar]
- Nussinov R, Liu Y, Zhang W, Jang H. Cell phenotypes can be predicted from propensities of protein conformations. Curr Opin Struct Biol. 2023a;83:102722. [DOI] [PMC free article] [PubMed] [Google Scholar]
- Nussinov R, Liu Y, Zhang W, Jang H. Protein conformational ensembles in function: roles and mechanisms. RSC Chem Biol. 2023b;4:850–864. [DOI] [PMC free article] [PubMed] [Google Scholar]
- Nussinov R, Tsai CJ, Jang H. Protein ensembles link genotype to phenotype. PLoS Comput Biol. 2019;15:e1006648. [DOI] [PMC free article] [PubMed] [Google Scholar]
- Nussinov R, Tsai CJ, Jang H. How can same‐gene mutations promote both cancer and developmental disorders? Sci Adv. 2022;8:eabm2059. [DOI] [PMC free article] [PubMed] [Google Scholar]
- Nussinov R, Yavuz BR, Arici MK, Demirel HC, Zhang M, Liu Y, et al. Neurodevelopmental disorders, like cancer, are connected to impaired chromatin remodelers, PI3K/mTOR, and PAK1‐regulated MAPK. Biophys Rev. 2023c;15:163–181. [DOI] [PMC free article] [PubMed] [Google Scholar]
- Onufriev A, Bashford D, Case DA. Exploring protein native states and large‐scale conformational changes with a modified generalized born model. Proteins. 2004;55:383–394. [DOI] [PubMed] [Google Scholar]
- Patel LA, Waybright TJ, Stephen AG, Neale C. GAP positions catalytic H‐Ras residue Q61 for GTP hydrolysis in molecular dynamics simulations, complicating chemical rescue of Ras deactivation. Comput Biol Chem. 2023;104:107835. [DOI] [PubMed] [Google Scholar]
- Patel NB, Stacy GS. Musculoskeletal manifestations of neurofibromatosis type 1. Am J Roentgenol. 2012;199:W99–W106. [DOI] [PubMed] [Google Scholar]
- Pettersen EF, Goddard TD, Huang CC, Couch GS, Greenblatt DM, Meng EC, et al. UCSF Chimera—a visualization system for exploratory research and analysis. J Comput Chem. 2004;25:1605–1612. [DOI] [PubMed] [Google Scholar]
- Phillips JC, Braun R, Wang W, Gumbart J, Tajkhorshid E, Villa E, et al. Scalable molecular dynamics with NAMD. J Comput Chem. 2005;26:1781–1802. [DOI] [PMC free article] [PubMed] [Google Scholar]
- Phillips JC, Hardy DJ, Maia JDC, Stone JE, Ribeiro JV, Bernardi RC, et al. Scalable molecular dynamics on CPU and GPU architectures with NAMD. J Chem Phys. 2020;153:044130. [DOI] [PMC free article] [PubMed] [Google Scholar]
- Rabara D, Tran TH, Dharmaiah S, Stephens RM, McCormick F, Simanshu DK, et al. KRAS G13D sensitivity to neurofibromin‐mediated GTP hydrolysis. Proc Natl Acad Sci U S A. 2019;116:22122–22131. [DOI] [PMC free article] [PubMed] [Google Scholar]
- Ratner N, Miller SJ. A RASopathy gene commonly mutated in cancer: the neurofibromatosis type 1 tumour suppressor. Nat Rev Cancer. 2015;15:290–301. [DOI] [PMC free article] [PubMed] [Google Scholar]
- Rauen KA. Defining RASopathy. Dis Model Mech. 2022;15:dmm049344. [DOI] [PMC free article] [PubMed] [Google Scholar]
- Rittinger K, Walker PA, Eccleston JF, Nurmahomed K, Owen D, Laue E, et al. Crystal structure of a small G protein in complex with the GTPase‐activating protein rhoGAP. Nature. 1997a;388:693–697. [DOI] [PubMed] [Google Scholar]
- Rittinger K, Walker PA, Eccleston JF, Smerdon SJ, Gamblin SJ. Structure at 1.65 A of RhoA and its GTPase‐activating protein in complex with a transition‐state analogue. Nature. 1997b;389:758–762. [DOI] [PubMed] [Google Scholar]
- Rudack T, Jenrich S, Brucker S, Vetter IR, Gerwert K, Kotting C. Catalysis of GTP hydrolysis by small GTPases at atomic detail by integration of X‐ray crystallography, experimental, and theoretical IR spectroscopy. J Biol Chem. 2015;290:24079–24090. [DOI] [PMC free article] [PubMed] [Google Scholar]
- Rudack T, Xia F, Schlitter J, Kotting C, Gerwert K. Ras and GTPase‐activating protein (GAP) drive GTP into a precatalytic state as revealed by combining FTIR and biomolecular simulations. Proc Natl Acad Sci U S A. 2012;109:15295–15300. [DOI] [PMC free article] [PubMed] [Google Scholar]
- Scheffzek K, Ahmadian MR, Kabsch W, Wiesmuller L, Lautwein A, Schmitz F, et al. The Ras‐RasGAP complex: structural basis for GTPase activation and its loss in oncogenic Ras mutants. Science. 1997;277:333–338. [DOI] [PubMed] [Google Scholar]
- Scheffzek K, Ahmadian MR, Wiesmuller L, Kabsch W, Stege P, Schmitz F, et al. Structural analysis of the GAP‐related domain from neurofibromin and its implications. EMBO J. 1998;17:4313–4327. [DOI] [PMC free article] [PubMed] [Google Scholar]
- Scheffzek K, Klebe C, Fritz‐Wolf K, Kabsch W, Wittinghofer A. Crystal structure of the nuclear Ras‐related protein Ran in its GDP‐bound form. Nature. 1995;374:378–381. [DOI] [PubMed] [Google Scholar]
- Scheffzek K, Shivalingaiah G. Ras‐specific GTPase‐activating proteins‐structures, mechanisms, and interactions. Cold Spring Harb Perspect Med. 2019;9:a031500. [DOI] [PMC free article] [PubMed] [Google Scholar]
- Scheidig AJ, Burmester C, Goody RS. The pre‐hydrolysis state of p21(ras) in complex with GTP: new insights into the role of water molecules in the GTP hydrolysis reaction of ras‐like proteins. Structure. 1999;7:1311–1324. [DOI] [PubMed] [Google Scholar]
- Schmidt VF, Wieland I, Wohlgemuth WA, Ricke J, Wildgruber M, Zenker M. Mosaic RASopathy due to KRAS variant G12D with segmental overgrowth and associated peripheral vascular malformations. Am J Med Genet A. 2021;185:3122–3128. [DOI] [PubMed] [Google Scholar]
- Schramm VL. Enzymatic transition states and transition state analog design. Annu Rev Biochem. 1998;67:693–720. [DOI] [PubMed] [Google Scholar]
- Seewald MJ, Korner C, Wittinghofer A, Vetter IR. RanGAP mediates GTP hydrolysis without an arginine finger. Nature. 2002;415:662–666. [DOI] [PubMed] [Google Scholar]
- Sethi A, Eargle J, Black AA, Luthey‐Schulten Z. Dynamical networks in tRNA:protein complexes. Proc Natl Acad Sci U S A. 2009;106:6620–6625. [DOI] [PMC free article] [PubMed] [Google Scholar]
- Sherekar M, Han SW, Ghirlando R, Messing S, Drew M, Rabara D, et al. Biochemical and structural analyses reveal that the tumor suppressor neurofibromin (NF1) forms a high‐affinity dimer. J Biol Chem. 2020;295:1105–1119. [DOI] [PMC free article] [PubMed] [Google Scholar]
- Shilyansky C, Lee YS, Silva AJ. Molecular and cellular mechanisms of learning disabilities: a focus on NF1. Annu Rev Neurosci. 2010;33:221–243. [DOI] [PMC free article] [PubMed] [Google Scholar]
- Shima F, Ijiri Y, Muraoka S, Liao J, Ye M, Araki M, et al. Structural basis for conformational dynamics of GTP‐bound Ras protein. J Biol Chem. 2010;285:22696–22705. [DOI] [PMC free article] [PubMed] [Google Scholar]
- Shirts MR, Klein C, Swails JM, Yin J, Gilson MK, Mobley DL, et al. Lessons learned from comparing molecular dynamics engines on the SAMPL5 dataset. J Comput Aided Mol Des. 2017;31:147–161. [DOI] [PMC free article] [PubMed] [Google Scholar]
- Sora V, Laspiur AO, Degn K, Arnaudi M, Utichi M, Beltrame L, et al. RosettaDDGPrediction for high‐throughput mutational scans: from stability to binding. Protein Sci. 2023;32:e4527. [DOI] [PMC free article] [PubMed] [Google Scholar]
- Spoerner M, Herrmann C, Vetter IR, Kalbitzer HR, Wittinghofer A. Dynamic properties of the Ras switch I region and its importance for binding to effectors. Proc Natl Acad Sci U S A. 2001;98:4944–4949. [DOI] [PMC free article] [PubMed] [Google Scholar]
- Sran S, Bedrosian TA. RAS pathway: the new frontier of brain mosaicism in epilepsy. Neurobiol Dis. 2023;180:106074. [DOI] [PubMed] [Google Scholar]
- Srinivasan J, Cheatham TE, Cieplak P, Kollman PA, Case DA. Continuum solvent studies of the stability of DNA, RNA, and phosphoramidate—DNA helices. J Am Chem Soc. 1998;120:9401–9409. [Google Scholar]
- Upadhyaya M, Osborn MJ, Maynard J, Kim MR, Tamanoi F, Cooper DN. Mutational and functional analysis of the neurofibromatosis type 1 (NF1) gene. Hum Genet. 1997;99:88–92. [DOI] [PubMed] [Google Scholar]
- van Gunsteren WF, Oostenbrink C. Methods for classical‐mechanical molecular simulation in chemistry: achievements, limitations. Perspectives J Chem Inf Model. 2024;64:6281–6304. [DOI] [PubMed] [Google Scholar]
- Verkhivker G, Alshahrani M, Gupta G, Xiao S, Tao P. From deep mutational mapping of allosteric protein landscapes to deep learning of Allostery and hidden allosteric sites: zooming in on “allosteric intersection” of biochemical and big data approaches. Int J Mol Sci. 2023;24:7747. [DOI] [PMC free article] [PubMed] [Google Scholar]
- Vigil D, Cherfils J, Rossman KL, Der CJ. Ras superfamily GEFs and GAPs: validated and tractable targets for cancer therapy? Nat Rev Cancer. 2010;10:842–857. [DOI] [PMC free article] [PubMed] [Google Scholar]
- Vogel AC, Gutmann DH, Morris SM. Neurodevelopmental disorders in children with neurofibromatosis type 1. Dev Med Child Neurol. 2017;59:1112–1116. [DOI] [PubMed] [Google Scholar]
- Wang E, Sun H, Wang J, Wang Z, Liu H, Zhang JZH, et al. End‐point binding free energy calculation with MM/PBSA and MM/GBSA: strategies and applications in drug design. Chem Rev. 2019;119:9478–9508. [DOI] [PubMed] [Google Scholar]
- Wang W, Kollman PA. Free energy calculations on dimer stability of the HIV protease using molecular dynamics and a continuum solvent model. J Mol Biol. 2000;303:567–582. [DOI] [PubMed] [Google Scholar]
- Weng C, Faure AJ, Escobedo A, Lehner B. The energetic and allosteric landscape for KRAS inhibition. Nature. 2024;626:643–652. [DOI] [PMC free article] [PubMed] [Google Scholar]
- Wirth D, Ozdemir E, Hristova K. Quantification of ligand and mutation‐induced bias in EGFR phosphorylation in direct response to ligand binding. Nat Commun. 2023;14:7579. [DOI] [PMC free article] [PubMed] [Google Scholar]
- Wirth D, Ozdemir E, Hristova K. Probing phosphorylation events in biological membranes: the transducer function. Biochim Biophys Acta Biomembr. 2024;1866:184362. [DOI] [PMC free article] [PubMed] [Google Scholar]
- Yan W, Markegard E, Dharmaiah S, Urisman A, Drew M, Esposito D, et al. Structural insights into the SPRED1‐neurofibromin‐KRAS complex and disruption of SPRED1‐neurofibromin interaction by oncogenic EGFR. Cell Rep. 2020;32:107909. [DOI] [PMC free article] [PubMed] [Google Scholar]
- Yap YS, McPherson JR, Ong CK, Rozen SG, Teh BT, Lee AS, et al. The NF1 gene revisited—from bench to bedside. Oncotarget. 2014;5:5873–5892. [DOI] [PMC free article] [PubMed] [Google Scholar]
- Young LC, Goldstein de Salazar R, Han SW, Huang ZYS, Merk A, Drew M, et al. Destabilizing NF1 variants act in a dominant negative manner through neurofibromin dimerization. Proc Natl Acad Sci U S A. 2023;120:e2208960120. [DOI] [PMC free article] [PubMed] [Google Scholar]
- Zeng J, Weng J, Zhang Y, Xia F, Cui Q, Xu X. Conformational features of Ras: key hydrogen‐bonding interactions of Gln61 in the intermediate state during GTP hydrolysis. J Phys Chem B. 2021;125:8805–8813. [DOI] [PubMed] [Google Scholar]
- Zhang M, Jang H, Li Z, Sacks DB, Nussinov R. B‐Raf autoinhibition in the presence and absence of 14‐3‐3. Structure. 2021;29:768–777.e2. [DOI] [PMC free article] [PubMed] [Google Scholar]
- Zhang M, Jang H, Nussinov R. The mechanism of PI3Kalpha activation at the atomic level. Chem Sci. 2019;10:3671–3680. [DOI] [PMC free article] [PubMed] [Google Scholar]
- Zhang W, Liu Y, Jang H, Nussinov R. CDK2 and CDK4: cell cycle functions evolve distinct, catalysis‐competent conformations, offering drug targets. JACS Au. 2024a;4:1911–1927. [DOI] [PMC free article] [PubMed] [Google Scholar]
- Zhang W, Liu Y, Jang H, Nussinov R. Slower CDK4 and faster CDK2 activation in the cell cycle. Structure. 2024b;32:1269–1280. [DOI] [PMC free article] [PubMed] [Google Scholar]
- Zhou YD, Zhao JF, Fang JS, Martin W, Li L, Nussinov R, et al. My personal mutanome: a computational genomic medicine platform for searching network perturbing alleles linking genotype to phenotype. Genome Biol. 2021;22:53. [DOI] [PMC free article] [PubMed] [Google Scholar]
Associated Data
This section collects any data citations, data availability statements, or supplementary materials included in this article.
Supplementary Materials
Data S1. Supporting Information.
Data Availability Statement
The data that support the findings of this study are available from the corresponding author upon reasonable request.