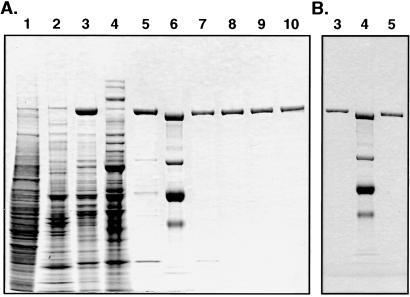
Figure 1.
SDS/PAGE analyses of FAS purified from the breast cancer cell line ZR75–1. (A) Various fractions were subjected to SDS/PAGE analysis (4–12% gradient), and the gel then was stained with Coomassie blue. Lane 1, soluble extract (25 μg); lanes 2, 3, and 4, HiLoad 26/10 Q-Sepharose fractions 29, 30–35, and 36 (10 μg of each fraction); lane 5, Superose-6 fraction (2 μg); lane 6, protein standard (molecular masses: 217, 123, 71, and 48 kDa); lanes 7, 8, 9, and 10, UNO-Q-6 fractions 56–59 (0.6 μg each). (B) For electron cryomicroscopic examination, the purified FAS (lane 5, 0.6 μg) was applied to an UNO-Q-6 column and fraction 3 (0.6 μg) was analyzed (lane 3). Lane 4 is a protein standard.

