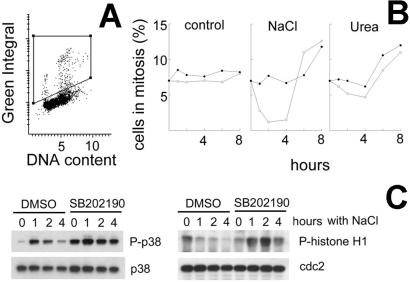
Figure 2.
Inhibition of p38 kinase prevents hypertonicity-induced G2 checkpoint activation. (A) Representative cytogram of mIMCD3 cells at 300 milliosmol/kg, stained for P-H3 (Green Integral) and PI (DNA content). Mitotic cells have high Green Integral fluorescence because of their high level of P-H3. The area of the cytograms containing mitotic cells is bounded by the trapezoid, drawn by eye. Cells falling within this area were classified as mitotic, as confirmed by microscopy. (B) mIMCD3 cells were preincubated for 30 min with vehicle (DMSO, open symbols) or 10 μM p38 inhibitor SB202190 (closed symbols). At 0 time, the medium was replaced to add urea or NaCl to total osmolality 500 milliosmol/kg, as indicated. Cells were fixed and stained with PI for DNA content and with P-H3 antibody for identification of mitotic cells. The percent of mitotic cells was determined by laser-scanning cytometry, as shown in A. (C) mIMCD3 cells were preincubated with SB202190 (10 μM) or DMSO for 30 min, and then the media were changed to otherwise identical ones for 4 h (“0 h with NaCl”) or to an otherwise identical one with NaCl added to total osmolality 550 milliosmol/kg for 1, 2, or 4 h. Protein extracts were prepared, and abundance of cdc2, p38, and p38 phosphorylated on Thr-180/Tyr-182 was determined by Western blot. Also cdc2 was immunoprecipitated, and its kinase activity was measured by phosphorylation of its substrate, histone H1.

