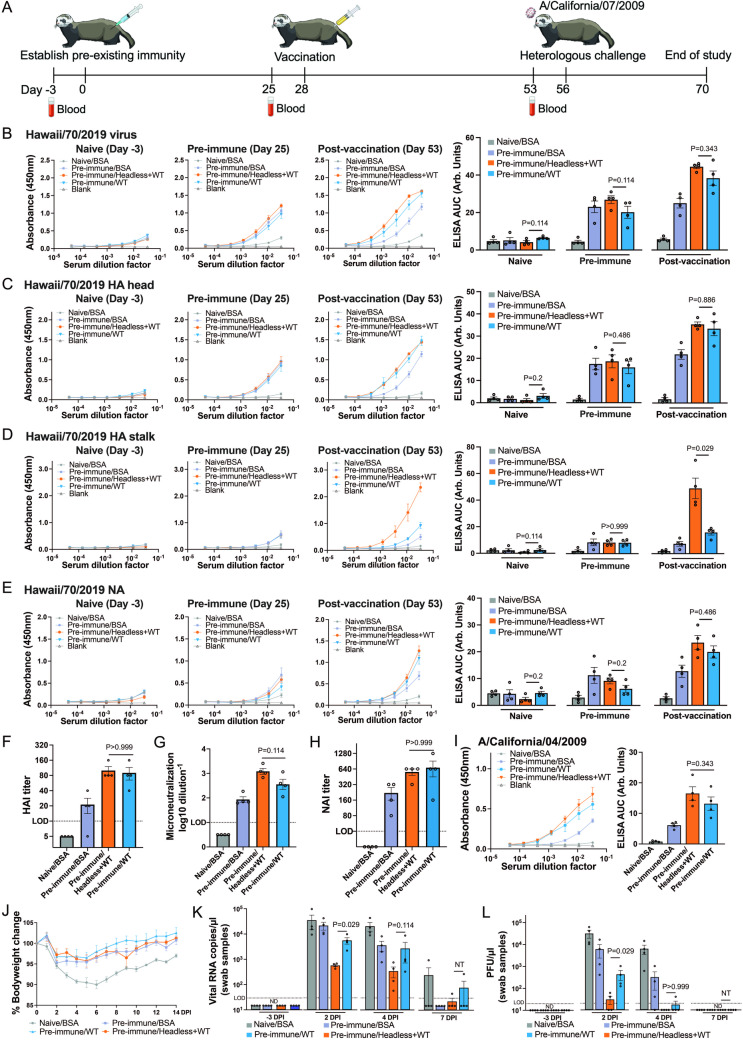
Fig 5. Immunogenicity and efficacy of the headless HA+WT HI/19 vaccine in ferrets with pre-existing immunity.
(A) Schematic of the vaccine regimen. Ferrets received one dose of WT HI/19 vaccine or BSA to establish pre-existing immunity. After 28 days, ferrets were administered either BSA, WT HI/19 vaccine or the headless HA+WT HI/19 vaccine. After another 28 days, ferrets were challenged with A/California/07/2009 virus. All sera were collected 3 days before vaccination or virus challenge. Images available at https://bioart.niaid.nih.gov/bioart/150, https://bioart.niaid.nih.gov/bioart/505, https://bioart.niaid.nih.gov/bioart/506, https://bioart.niaid.nih.gov/bioart/87 and https://bioart.niaid.nih.gov/bioart/187 provided by the NIH BioArt source were used in this figure panel. (B–E) Naive sera collected before vaccination, sera collected after establishment of pre-existing immunity, and sera collected post-vaccination were used to detect antibody responses against whole HI/19 virus. (B), HI/19 HA head (C), HI/19 HA stalk (D) and HI/19 NA (E) via ELISA. N = 4 ferrets. (F) Hemagglutination inhibition assay (HAI) with post-vaccination sera. HAI titers were calculated as the reciprocal of the last dilution of sera that inhibited hemagglutination. LOD = 10. N = 4 ferrets. (G) Microneutralization assay with post-vaccination sera. LOD = 1. N = 4 ferrets. (H) Neuraminidase-inhibition (NAI) assay with post-vaccination sera. NAI titer is calculated as the reciprocal of the lowest dilution of sera that inhibited at least 50% NA activity. N = 4 ferrets. LOD = 40. (I) Post-vaccination sera was used to detect antibody responses against whole A/California/04/2009 virus via ELISA. N = 4 ferrets. (J) Body weight of vaccinated ferrets with pre-existing immunity was monitored until 14 days post infection. N = 4 ferrets. (K) Viral RNA level in nasal swab samples after infection. Nasal swab samples collected at 3 days before infection, 2 days post-infection (DPI), 4 DPI, 7 DPI were analyzed for RT-qPCR. Viral NP gene was detected. (L) Plaque assay in nasal swab samples after infection. Nasal swab samples were collected at 3 days before infection, 2 DPI , 4 DPI, 7 DPI were analyzed. Undetectable samples were treated as 50% of LOD for statistical analysis. ND, not detected. NT, not tested. Except for panels F-J, all experiments were technically performed at least 2 times and similar results were observed. For panels B-I and K-L, Mann-Whitney U tests were performed. Data shown as mean ± SEM.

