
Fig. 8.
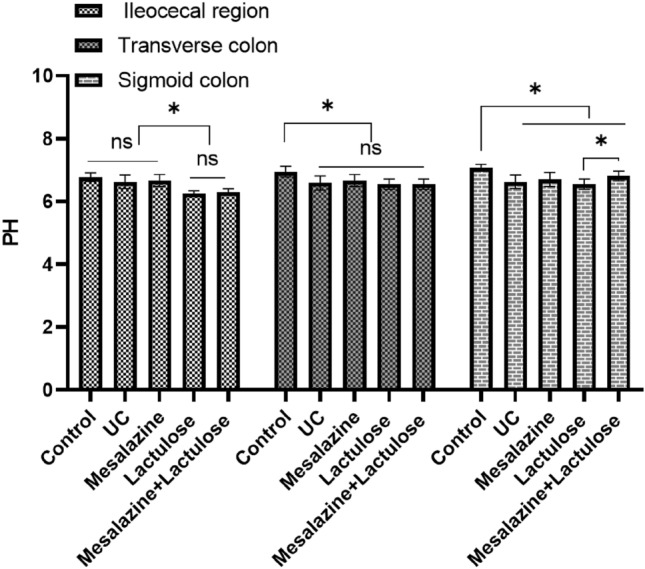
The pH levels in the ileocecal region, transverse colon, and sigmoid colon of 5 treatment groups. Data are presented as mean ± SD; * indicates P < 0.05; “ns “ represents no significant difference.
Official websites use .gov
A
.gov website belongs to an official
government organization in the United States.
Secure .gov websites use HTTPS
A lock (
) or https:// means you've safely
connected to the .gov website. Share sensitive
information only on official, secure websites.
The pH levels in the ileocecal region, transverse colon, and sigmoid colon of 5 treatment groups. Data are presented as mean ± SD; * indicates P < 0.05; “ns “ represents no significant difference.