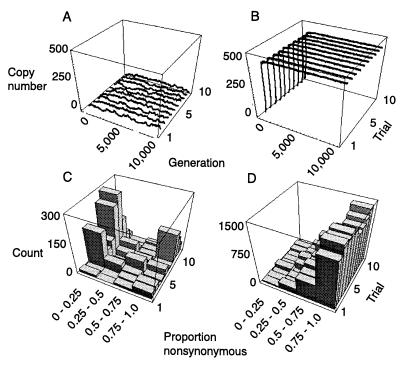
Figure 4.
Simulated retrotransposon dynamics and sequence evolution. Copy number versus generation under: (A) high excision rate (V = 0.005) and stronger selection (t = 1.5) or (B) low excision rate (V = 0.00001) and weaker selection (t = 1.25). Proportion of nucleotide changes that are nonsynonymous under: (C) high excision and stronger selection (parameter values as in A) and (D) low excision and weaker selection (parameter values as in B). Illustrated are copy number versus generation, and patterns of substitution for 10 different simulation trials per parameter combination. Other simulation parameters used were identical in all runs and were: n = 50 individuals, L = 500 insertion sites, E = 10 TEs per genome at start of simulation, transposition rate U = 0.01, selection coefficient s = 0.0005, per element probability of mutation υ = 0.001, reduction in probability per nonsynonymous mutation P = 0.2. Histograms of proportions of nonsynonymous changes are based on sampling the haploid complement of elements from 10 individuals per trial at generation 10,000.

