Figure 5.
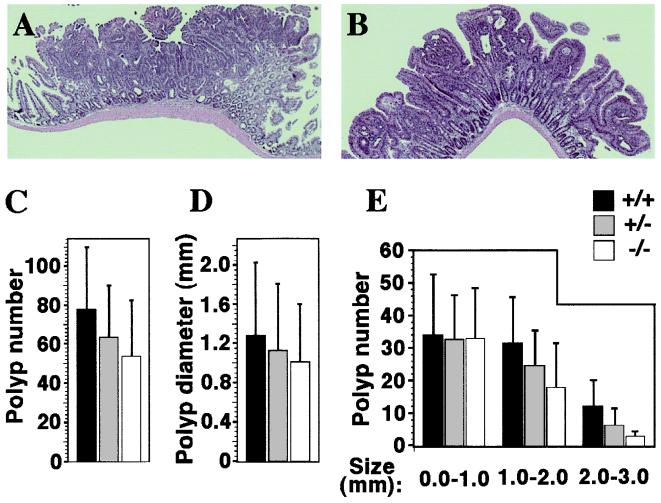
Intestinal polyp analysis in PPARδ-deficient APCmin mice. Histology of representative polyps from wt (A) and PPARδ−/− (B) APCmin mutants. Both adenomas display a similar, benign, tubular phenotype, regardless of the genetic status of PPARδ. (Magnification: ×16.) (C) Average polyp numbers in APCmin females carrying PPARδ+/+ (black bars; 77.6 ± 32.3), PPARδ+/− (gray bars; 63.6 ± 26.4), and PPARδ−/− genotypes (white bars; 54.0 ± 28.7). Differences between these values are statistically insignificant. (D) Median polyp diameters in PPARδ+/+ (1.28 ± 0.75 mm), PPARδ+/− (1.13 ± 0.68 mm), and PPARδ−/− (1.01 ± 0.59 mm). Differences between these values are statistically insignificant. (E) Intestinal polyp size distribution. Polyps in each of the three PPARδ genotypes were classified into three size ranges (0–1.0 mm; 1.0–2.0 mm; 2.0–3.0 mm). Note that wt PPARδ allele dosage is directly related to the incidence of larger polyps (>1.0 mm). However, differences are still statistically insignificant according to Student's t test.

